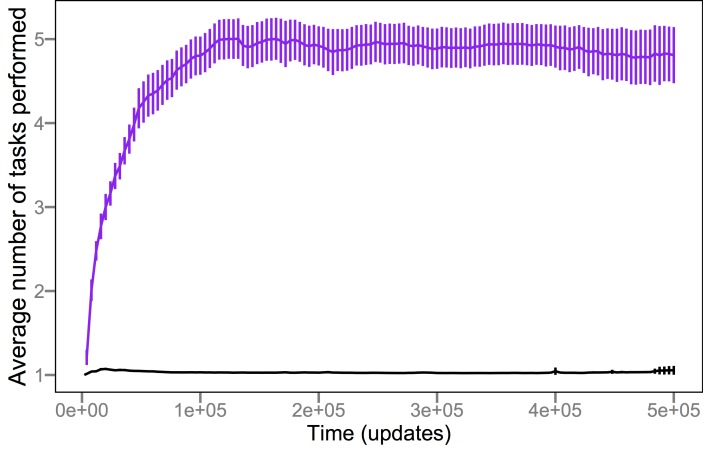
Figure 3. Parasites evolve generalist strategies while hosts remain specialists.
The purple trajectory shows the average number of different functions performed by individual parasites across 50 replicates of the coevolution treatment. In 12 cases, the parasite population eventually went extinct, and so the number of replicates declines to 38 over time. The black trajectory shows the corresponding average for individual hosts; host populations were excluded from the average after the corresponding parasite populations had gone extinct. Error bars are ±2 standard errors of the mean (SEM).

