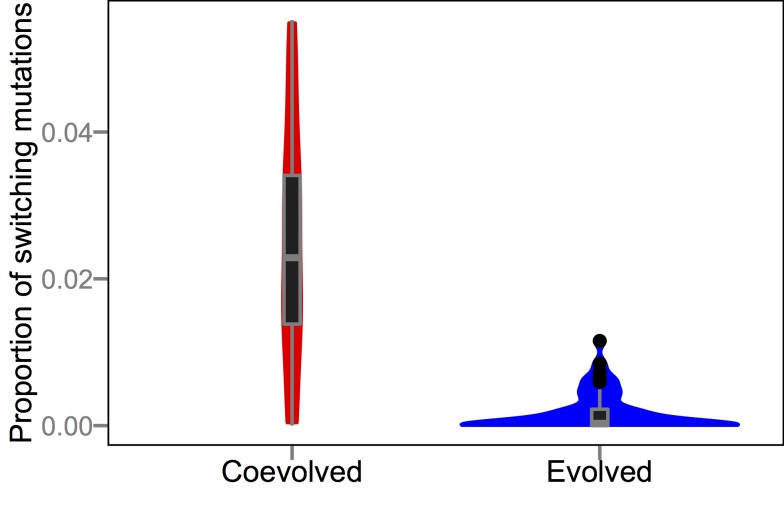
Figure 9. Proportion of point mutations in host genomes that switch functions without changing the number of functions performed.
The data are shown as box plots and smoothed frequency distributions. Proportions were obtained by testing all possible one-step point mutations in the genetic background of the most abundant host genotype at the end of all 50 runs with and without parasites. Box hinges depict first and third quartiles and whiskers extend 1.5×interquartile range (IQR) out from their corresponding hinge.

