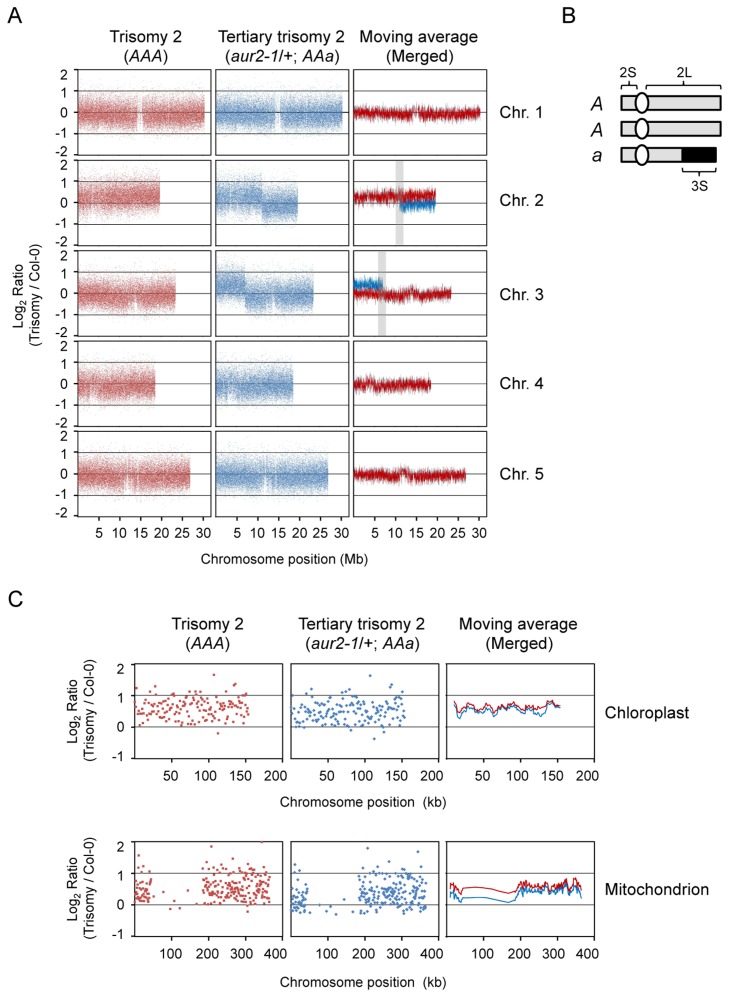
Figure 2. The aur2-1/+ is tertiary trisomy 2 revealed by array comparative genome hybridization (array CGH).
(A) The log2 ratios of signal intensity of Arabidopsis chromosomes in trisomics (AAA or AAa) to wild-type diploids (Col-0). Each dot indicates one set of probes corresponding to a unique position on the chromosomes (Chr.). Locations of centromeres are the area with fewer dots. Shaded area in chromosome 2 indicates the region containing the translocation breakpoint. (B) A schematic representation of chromosome 2 in aur2-1/+. S, short; L, long arm of chromosomes. (C) The log2 ratios of signal intensity of chloroplast and mitochondria genomes in trisomy (AAA or Aaa) to wild-type diploid (Col-0). Genome duplication is identified by the ratio shifting above the baseline at 0. The moving average is a series of averages of 10 probe sets.

