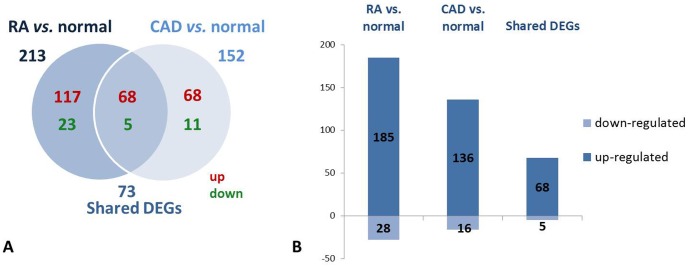
Figure 1. Gene expression in groups of RA vs. normal, CAD vs. normal and shared DEGs.
A: Venn diagram showing the number of uniquely up-regulated (red) or down-regulated (green) genes comparing individuals with RA and CAD to normal persons and shared DEGs; B: Bar diagram indicating number of DEGs in the RA vs. normal and the CAD vs. normal groups and the shared DEGs between them.

