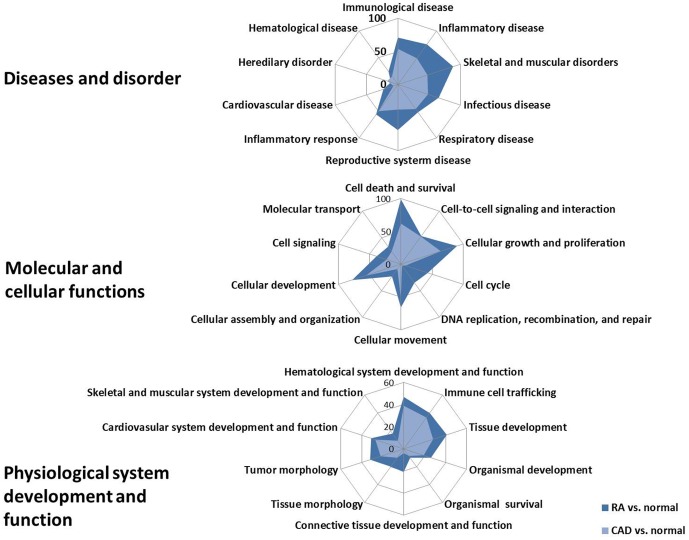
Figure 2. The shared functions of DEGs in individuals with RA and CAD compared to normal controls.
Radar diagrams show the shared functions of DEGs in RA and CAD compared to normal controls in aspects of ‘Diseases and disorder’, ‘Molecular and cellular functions’, and ‘Physiological system development and function’. Blue areas represented the number of DEGs in RA vs. the normal number involved in the functions. Red areas represent the number of DEGs in CAD vs. normal controls involved in the functions.

