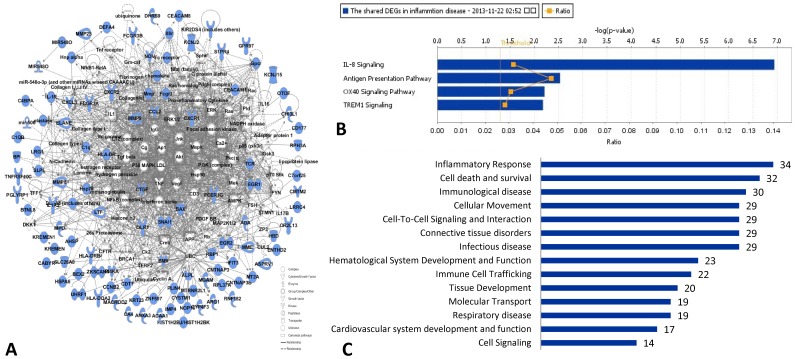
Figure 3. Network, molecular functions and canonical pathway analysis of shared DEGs in RA vs. normal and CAD vs. normal individuals.
A: The molecular network of 95 shared DEGs in RA vs. normal and CAD vs. normal individuals; blue molecules represent the shared DEGs; B: the top 4 shared canonical pathways (with score (-log (p-value))>1.3, p-value of pathway <0.05) related with inflammation which 95 shared DEGs in RA vs. normal and CAD vs. normal involved in: IL-8 signaling; antigen presentation pathway; OX40 signaling pathway; TREM1 signaling; C: the function classification of shared DEGs in both RA vs. normal and CAD vs. normal, the number in the bar diagram represented the DEGs numbers participated in the corresponding pathways.

