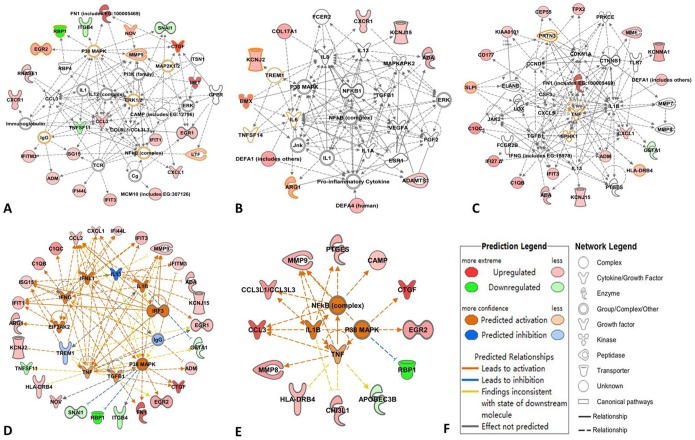
Figure 5. The shared molecular networks and upstream regulators networks of RA and CAD.
A: shared associated network (SAN) -1; B: SAN-2; C: SAN-3; D: the network of upstream regulators and target molecules of DEGs in RA; E: the network of upstream regulators and target molecules of DEGs in CAD; F: the legends of predicted networks. In A, B and C, the molecules with orange circles stand for shared molecules between RA and CAD.

