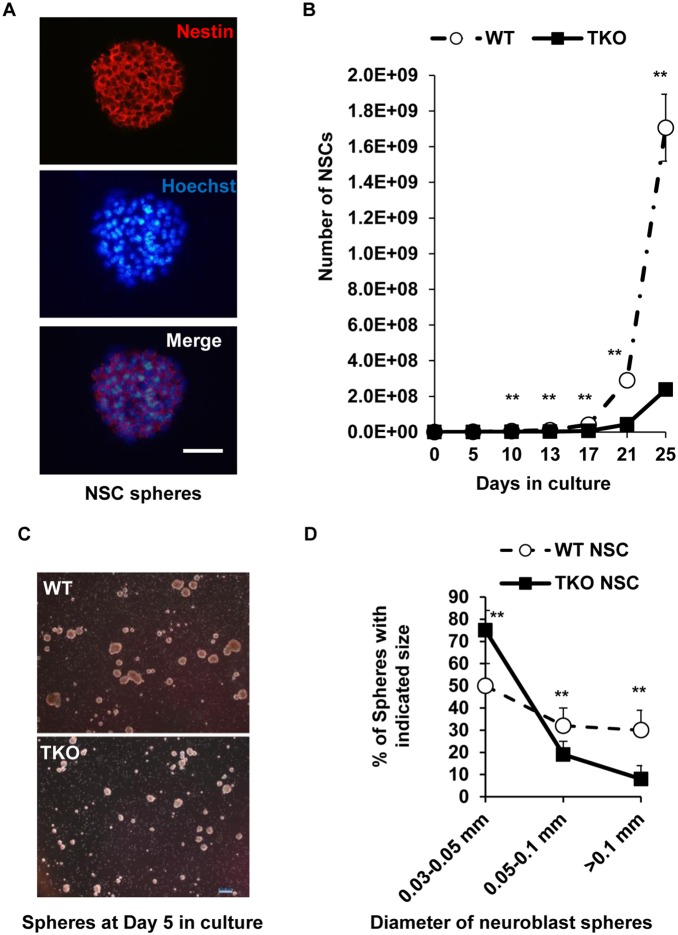
Figure 2. TAM receptors support primary NSCs growth and survival.
(A) The WT NSC spheres were subjected to cryostat sectioning as described in the Method. The sections were immunostained using anti-nestin antibody, and nuclei were stained blue using Hoechst 33342. Scale bar, 100 µm. (B) To maintain healthy growth of the NSCs, neuronal spheres were subcultured as described in the Method. The total cell number at each time point was calculated based on the cell number from each count and the fraction of the cells used for the next cycle of subculture. The growth curves are plotted as total cell numbers against days in culture. Data are expressed as the means ± SD at each time point. **P<0.01, n = 3. (C) NSC spheres were developed from single cell suspension of both WT and TKO NSCs in 5 days and photographed, scale bar, 200 µm. (D) The newly developed spheres in each of the WT and TKO samples were designated into three groups based on the sphere sizes of large (>0.1 mm), middle (0.05–0.1 mm) and small (0.03–0.05 mm) in diameter. The number of spheres in each group was counted and the percentage of each group among the same phenotype spheres was plotted. The data are expressed as the mean ± SD of three experiments. **P<0.01, n = 3.

