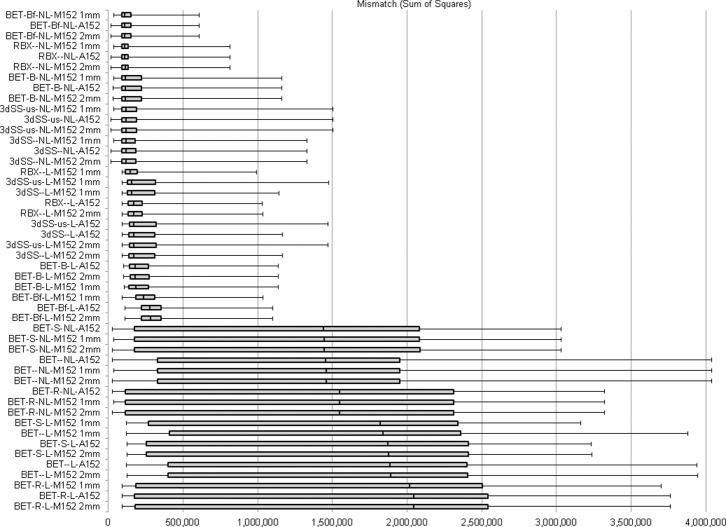
Figure 1. Optimization results.
Box plot depiction of the mismatch between each tested pipeline and the manually brain-extracted “benchmark” images. Increased sum of squares implies lower extraction quality – as compared to the benchmark extractions. (RBX: Robex; 3dSS: 3dSkullStrip; us: useskull; L: linear transformation; NL: non-linear transformation; M152: MNI152; A152: Average152. The boxplot depicts the 25th, 50th (i.e., median) and 75th percentiles, and top and bottom whiskers depict the maximum and minimum values, respectively).

