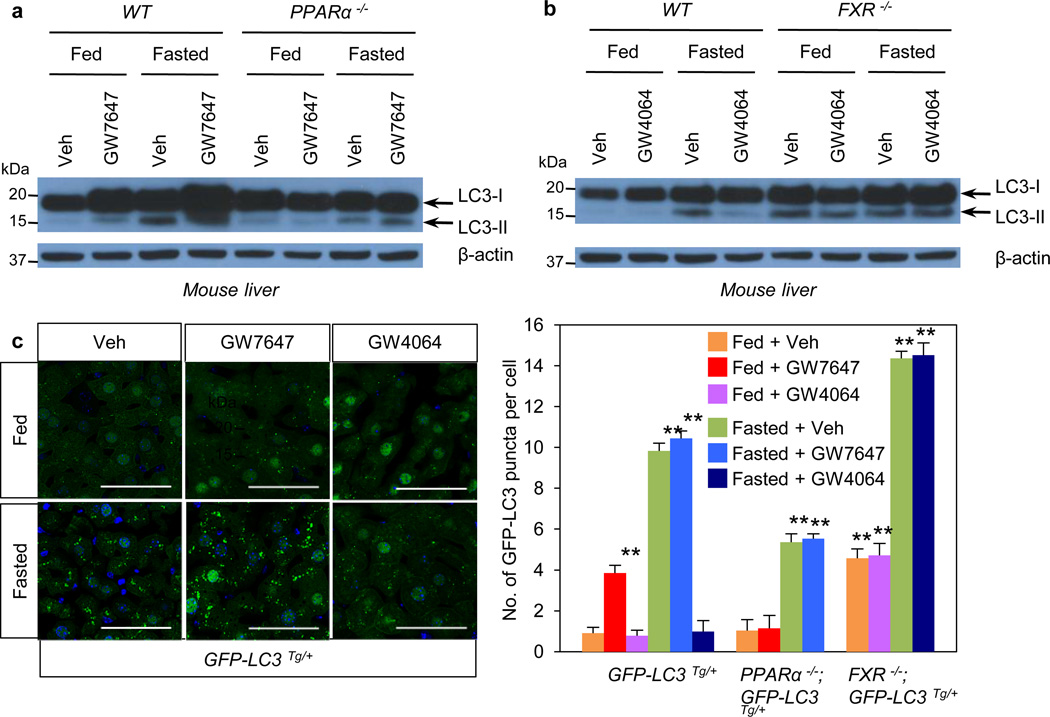
Figure 2. Activation of PPARα or FXR controls autophagy in liver.
a and b, Fed or fasted WT PPARα−/−, or FXR−/− mice treated with Veh, GW7647 or GW4064. LC3 Immunoblots of liver samples. Lanes are pooled (n=5 per group). c, Representative confocal images (out of 9 tissues sections per condition) of liver GFP-LC3 puncta (green: autophagosomes), DAPI (blue: DNA). Fed or fasted GFP-LC3Tg/+, bigenic PPARα−/−; GFP-LC3Tg/+, or FXR−/−; GFP-LC3Tg/+ mice treated with Veh, GW7647, or GW4064. Fixed liver samples analyzed by confocal microscopy. Scale bar, 50 µm. GFP puncta per cell are quantified in graph. Data represent mean±s.e.m. of 9 tissue sections. (n=3 per group, **P < 0.01 vs Fed GFP-LC3Tg/+ mice treated with Veh). Statistics by two-tailed t-test.

