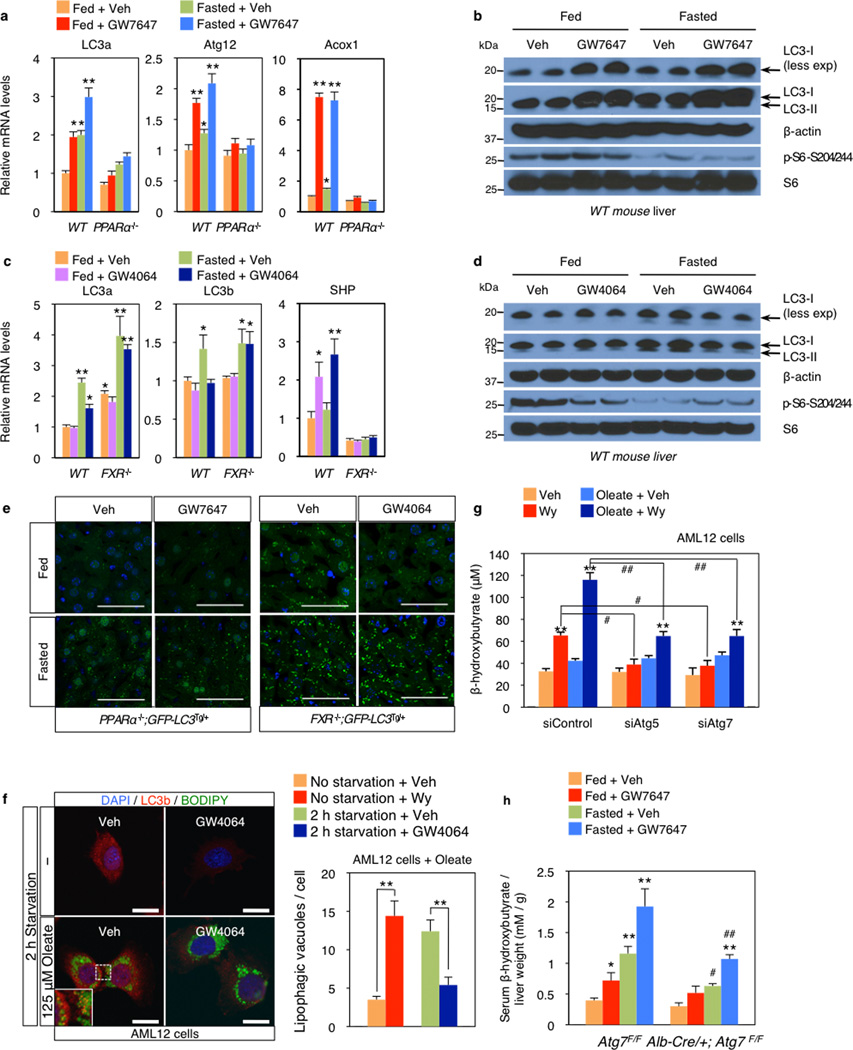
Extended Data Figure 3. Pharmacologic activation of PPARα or FXR in fed or fasted mouse liver.
a and c, Hepatic expression levels of autophagy-related genes (LC3a, LC3b and Atg12), PPARα target gene (Acox1), and FXR target gene (SHP) were determined by qPCR analysis. Fed or fasted WT PPARα−/−, or FXR−/− mice were orally treated with Veh, GW7647, or GW4064 twice a day. (n=5 per group, *P < 0.05, **P < 0.01 vs Fed WT mice treated with Veh). b and d, Immunoblot analysis of LC3-I/II, β-actin, phospho-S6 (p-S6S240/244), and total S6 (S6) in liver samples. Fed or fasted WT mice were orally gavaged with Veh, GW7647, or GW4064 twice a day. A pooled sample was loaded onto the gel in duplicates. (n=5 per group). β-actin is a loading control. e, Representative confocal images (out of 9 tissue section per condition) of GFP-LC3 puncta (GFP color: autophagosomes) and DAPI (blue color: DNA) staining in livers. Fed or fasted bigenic PPARα−/−; GFP-LC3Tg/+, or FXR−/−; GFP-LC3Tg/+ mice were orally gavaged with Veh, GW7647, or GW4064 twice a day. Liver samples were fixed and cryosections were analyzed by confocal microscopy. Scale bar, 50 µm. f, Co-localization of BODIPY 493/503 (green) with LC3 (red) in AML12 cells treated with Veh or 1 µM of GW4064 for 24 h and simultaneously cultured with or without 125 µM oleate in complete medium. GW4064-treated cells were starved for 2 h. DNA was stained with DAPI (blue). Scale bar, 20 µm. Quantification of Lipophagic vacuoles shown in Fig. 3b and Extended Data Fig. 3f. 30 cells were counted per condition (**P < 0.01). g, Measuring β-hydroxybutyrate. AML12 cells were transiently transfected with siControl, siAtg5, or siAtg7 for 24 h followed by indicated drug treatments for 48 h with or without 250 µM oleate (Veh: 0.1% DMSO, Wy; 10 µM Wy-14,643). Released β-hydroxybutyrate in the medium was determined. (**P < 0.01 vs siControl treated with Veh; #P < 0.01 vs siControl treated with Wy; ##P < 0.01 vs siControl treated with Oleate + Wy). h, Serum β-hydroxybutyrate were normalized with liver weights. Fed or 24 h fasted control littermates (Atg7F/F) and hepatocyte-specific Atg7F/F null (Alb-Cre/+; Atg7F/F) mice were treated with Veh or GW7647 twice a day. (n=4 per group, *P < 0.05, **P < 0.01 vs Fed Atg7F/F mice treated with Veh; #P < 0.01 vs Fasted Atg7F/F mice treated with Veh; ##P < 0.01 vs Fasted Atg7F/F mice treated with GW7647). Panels in a, c, g, f and h, data represent mean±s.e.m. Statistics by two-tailed t-test.

