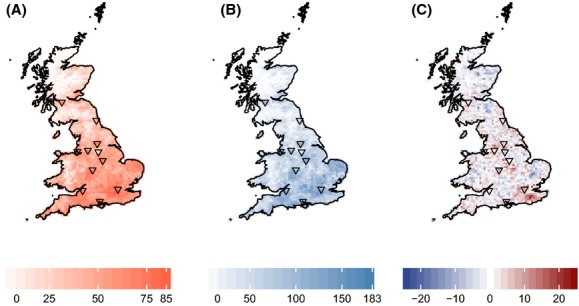
Figure 2.

Species richness of invasive (A) and non-invasive (B) alien species across Britain based on atlas data (Preston et al. 2002) at the hectad scale. (C) Residuals from a loess (local second-degree polynomial) regression (smoothing parameter, α = 0.75; pseudo-R2 = 0.951) of invasive and non-invasive species richness. Positive residuals are indicated in red, while negative residuals are shown in blue. Triangles indicate the 11 densest cities.
