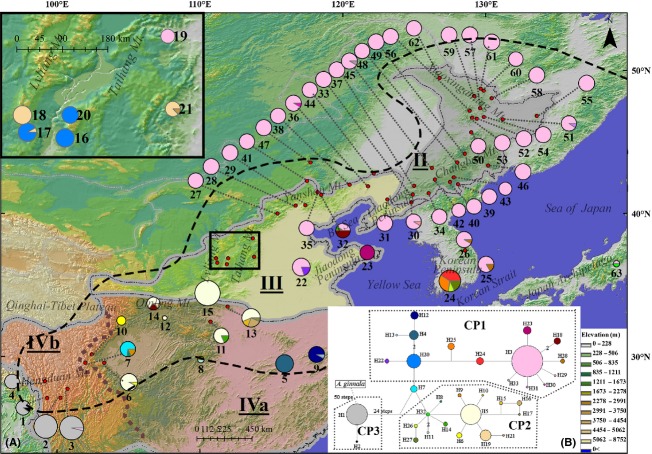
Figure 2.
(A) Geographic distribution of the 33 chloroplast haplotypes. The size of the pies corresponds to sample size of each population. The area in Taihang and Lvliang Mts.(in the black frame) is magnified at the top left. The distribution range of Acer mono represents by the black dash line was modified as Hsu (1992).The different vegetation regions were separated by gray borders and different shadow colors in the map. The brown dash line divided vegetation region IV (subtropical evergreen broad-leaved forest region) into two subregions. The borders of vegetation region and subregion were both drawn according to Zhang (2007). Vegetation region/subregion names were abbreviated as follows: II, temperate coniferous broad-leaved mixed forest region (gray shadow); III, warm temperate deciduous broad-leaved forest region (yellow shadow); IVa, eastern subtropical evergreen broad-leaved forest region (red shadow); IVb, western subtropical evergreen broad-leaved forest region (red shadow). (B) The median-joining network of 33 cpDNA haplotypes. The size of pies is proportional to the haplotype frequency. Solid lines represent mutational steps interconnecting two haplotypes. Each line represents 1 step, except for the lines with additional annotation. The three clades were indicated by surrounding gray dotted line according to consensus tree in Fig. 4.

