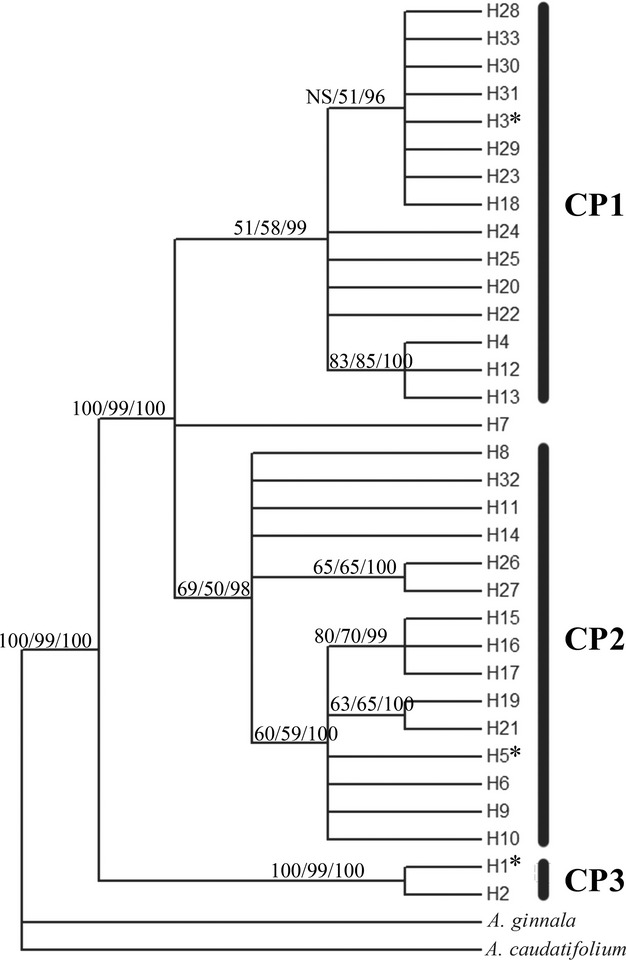
Figure 4.

Rooted consensus trees for the chloroplast haplotypes. The values on the branches are bootstrap support values for the maximum-likelihood (left) and maximum-parsimony (middle) analyses and the posterior probability (right) of the Bayesian analysis. The sequences of haplotypes with “*”were used in construction of the phylogenetic trees in Fig. 3.
