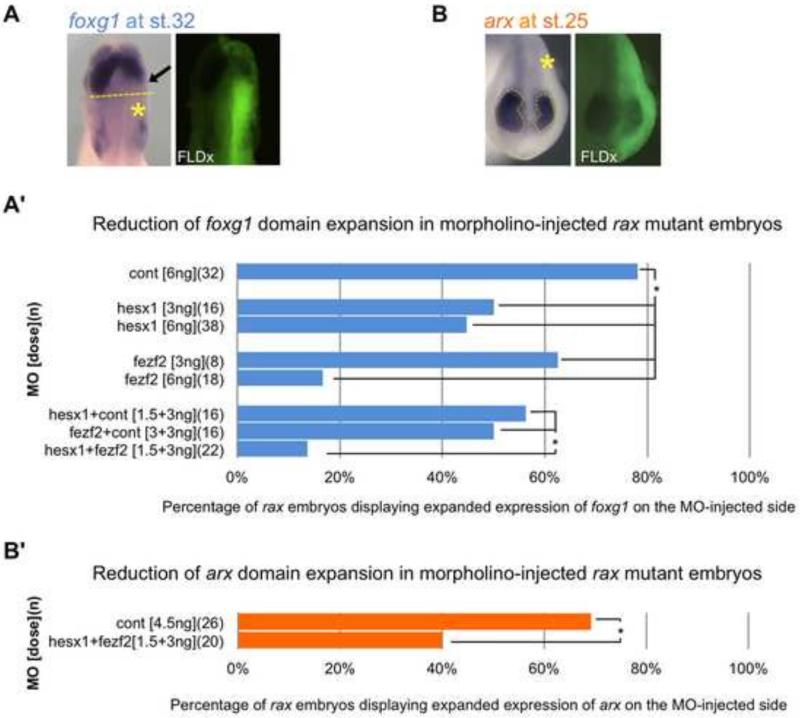
Figure 8. Knockdown of fezf2 and/or hesx1 function reduces expanded foxg1- and arx- expressing region(s) in rax mutant embryos.
(A) Representative example of the dorsal view of St. 32 rax mutant embryos injected with fezf2 and/or hesx1 MO(s), and assayed for foxg1 expression by in situ hybridization (left panel). Note that reduced signal is seen in the ectopically expanded foxg1-expressing region (arrow, left panel) on the injected side of mutant embryos (yellow asterisk, left panel), as visualized by FLDx tracer (right panel). (A’) Percentage of embryos with mutant phenotype (expanded foxg1 expression) on injected side after receiving MO(s) injection. Embryos were injected into one dorsal blastomere at the 4-cell stage with either control, fezf2 or hesx1 morpholinos, or a combination of two morpholinos, as indicated in the y-axis. (B) Representative example of the frontal view of a St. 25 rax mutant embryo injected with combined fezf2 and hesx1 MOs, and assayed for arx expression by in situ hybridization (left panel). Dashed yellow outlines mark the region of arx expression, which is reduced on the injected side (marked with an asterisk, and visualized by FLDx tracer in right panel). (B’) Percentage of embryos with mutant phenotype (expanded arx expression) on injected side after receiving MO(s) injection. Embryos were injected into one dorsal blastomere at the 4-cell stage with either control or combined fezf2 or hesx1 morpholinos. (A’-B’) Injected doses of morpholinos is indicated in brackets, and numbers of embryos scored in parentheses. Asterisks indicate p-values of <0.05 by chi-squared test.

