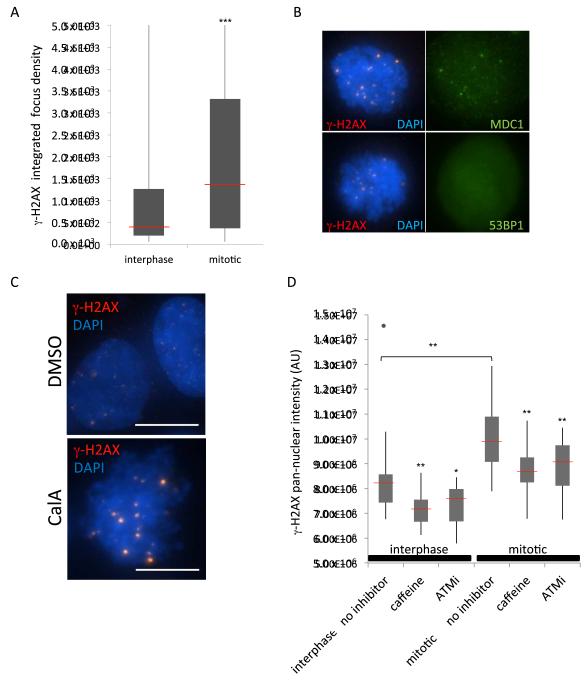
Figure 5. Mitotic chromosome condensation activates chromatin-induced DDR.
(A) Individual γ-H2AX foci quantified by integrated density measurements. Box: quartiles 1 - 3, whiskers: value range, red bar: median values, as follows: 487 (interphase), 1317 (mitosis). ***p < 0.001, N > 300 foci for each. (B) Mitotic cells were harvested by shake-off, attached to slides and stained for γ-H2AX (red), and either MDC1 or 53BP1 (green). Shown are maximum intensity projections with DAPI overlay (blue). (C) Increased γ-H2AX foci in cells treated with 50 nM CalA for 60 min, fixed and immunostained for γ-H2AX (red), and DAPI (blue). Scale bar, 10 μm. (D) Total nuclear intensity of γ-H2AX from cells in indicated treatments. Box and whiskers as in A. One single outlier (>1.5 times outside the interquartile range) is marked with a gray dot, and the red bars indicate median values. *p < 0.05, ** p < 0.01. See also Supplemental Figure S5.

