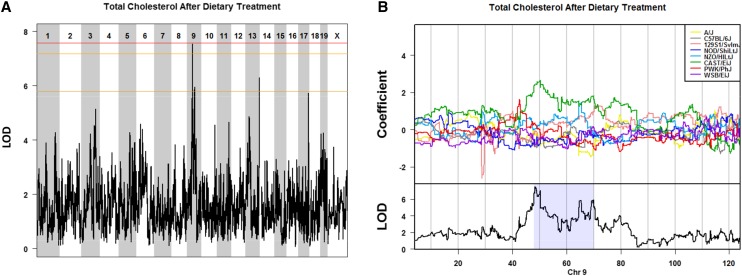
Figure 4.
Effect of diet on total cholesterol in the DO mice. Genome-wide QTL scan for loci affecting plasma levels of total cholesterol after 18 wk of dietary treatment (A). Chromosomes 1 through X are represented numerically on the x-axis, and the y-axis represents the LOD score. The relative width of the space allotted for each chromosome reflects the relative length of each chromosome. Plasma was taken from 24-wk-old mice after 18 wk of dietary treatment. Colored lines show permutation-derived significance thresholds (N = 1000) at P = 0.05 (LOD = 7.57, shown in red), P = 0.10 (LOD = 7.17, shown in orange), and P = 0.63 (LOD = 5.79, shown in yellow). The eight coefficients of the QTL model show the effect of each founder haplotype on the phenotype. Shading identifies the 95% Bayesian credible interval around the peak (B). DO, Diversity Outbred; QTL, quantitative trait locus; LOD, log of the odds ratio.

