Figure 5.
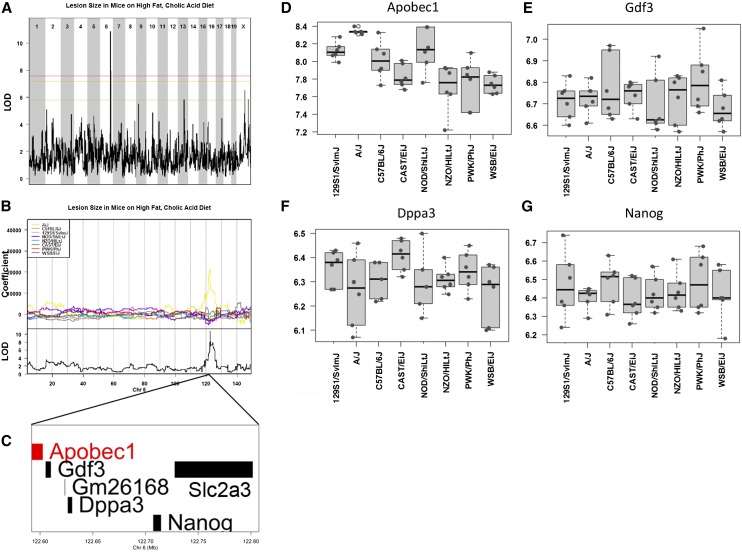
QTL mapping of atherosclerosis in the DO mice. Genome-wide QTL scan for loci affecting atherosclerotic lesion size in mice fed a high-fat, cholic acid diet (A). Chromosomes 1 through X are represented numerically on the x-axis, and the y-axis represents the LOD score. The relative width of the space allotted for each chromosome reflects the relative length of each chromosome. Hearts were harvested from 146 mice after 18 wk on a high-fat, cholic acid diet. Colored lines show permutation-derived significance thresholds (N = 1000) at P = 0.05 (LOD = 7.57, shown in red), P = 0.10 (LOD = 7.17, shown in orange), and P = 0.63 (LOD = 5.79, shown in yellow). The eight coefficients of the QTL model show the effect of each founder haplotype on the phenotype. A/J founder alleles are associated with larger lesion size in the DO mice (B). There are six candidate genes within the 100,000-kb QTL interval on Chromosome 6: Apobec1, Gdf3, Dppa3, Nanog, Slc2a3, and the predicted gene Gm26168 (C). Gene expression data were obtained from livers from female C57BL6/J, A/J, NOD/ShiLtJ, NZO/HiLtJ, WSB/EiJ, CAST/EiJ, PWK/PhJ, and 129S1/SvImJ mice (http://cgd.jax.org/gem/strainsurvey26). Of the six candidate genes in the QTL interval on Chromosome 6, four were assayed by microarray for hepatic gene expression: Apobec1 (D), Gdf3 (E), Dppa3 (F), and Nanog (G). Apobec1 is the only candidate in this region that matches our allele effects such that A/J mice specifically express higher levels of Apobec1. QTL, quantitative trait locus; DO, Diversity Outbred; LOD, log of the odds ratio.

