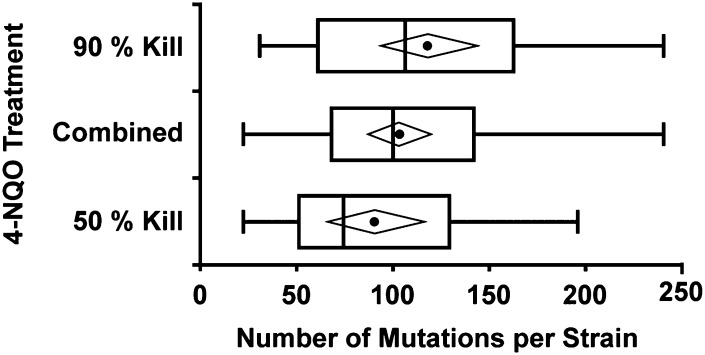
Figure 1.
Number of point mutations per strain is not dose-dependent. Distribution of the number of mutations per strain resulting from 50% kill (N = 17; 0.24 µg mL−1 4-NQO per 107 spores) and 90% kill (N = 20; 0.45 µg mL−1 4-NQO per 107 spores) as well as combined data (N = 38). There was no significant difference between the number of mutations induced by 50% kill compared with 90% kill using unpaired unequal distribution Student’s t-test. The combined data includes the single mutant from 97% kill (4.0 µg mL−1 4-NQO per 108 spores) with 70 mutations. Boxplots show minimum and maximum (whiskers), median (dividing line), mean (circle), and 95% confidence interval of mean (diamond).

