Figure 2.
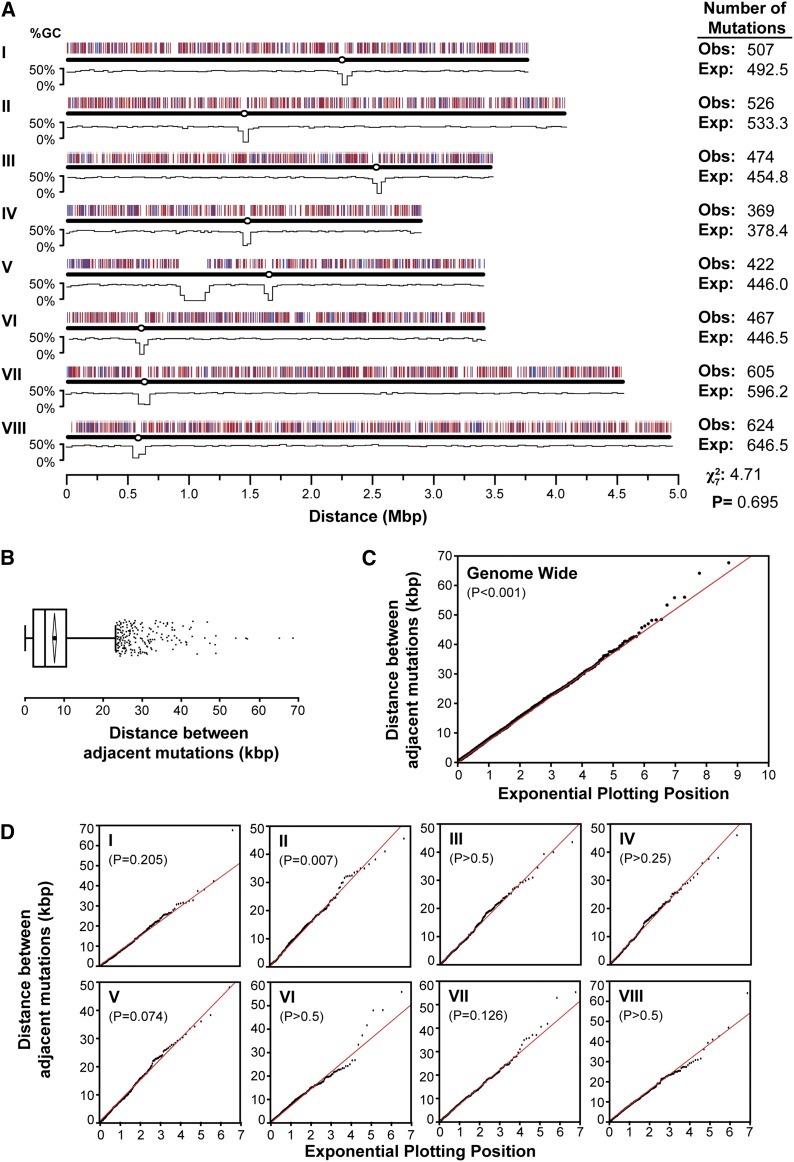
4-NQO mutations are randomly distributed across the genome. (A) A. nidulans chromosome map showing locations of 3994 mutations arising from 4-NQO mutagenesis and %GC content (Galagan et al. 2005). Mutations within genes (transcribed regions) are red and those outside genes are blue. Centromeres are marked as circles. Expected (Exp.) number of mutations per chromosome was calculated by dividing 3994 by the proportion of genome content in each chromosome. Obs., observed. (B) Boxplot of distance between mutations showing minimum and maximum values within 1.5 × interquartile range of the box (whiskers), median (dividing line), mean (circle), 95% confidence interval of mean (diamond), and outliers (squares). (C−D) Exponential quantile-quantile plot of distances between mutations compared with theoretical exponential distribution (red line) where λ−1 = mean. P-value shown for Kolmogorov-Smirnov test D statistic. N is the number of distances between mutations. Distances between mutations flanking centromeres and the ribosomal repeats were excluded. Genome (N = 3977, mean = 7461.44, D = 0.0247), I (N = 505, mean = 7332.67, D = 0.0388), II (N = 524, mean = 7610.55, D = 0.0584), III (N = 472, mean = 7226.80, D = 0.0297), IV (N = 367, mean = 7717.14, D = 0.0375), V (N = 419, mean = 7411.85, D = 0.0529), VI (N = 465, mean = 7167.69, D = 0.0251), VII (N = 603, mean = 7397.4, D = 0.0389), VIII (N = 622, mean = 7782.67, D = 0.0201).

