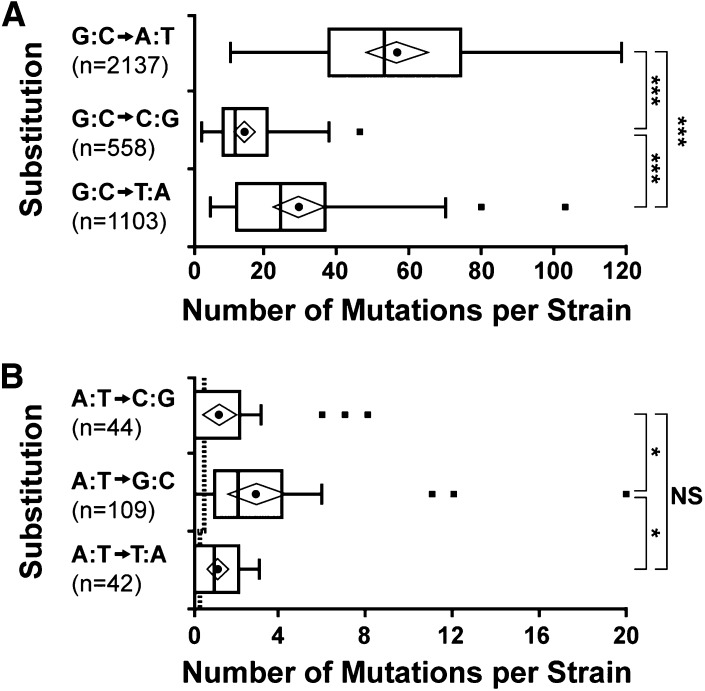
Figure 3.
4-NQO induces all six possible base pair substitutions. Distribution of the number of substitutions affecting guanine-cytosine (A) and adenine-thymine (B) base pairs per mutant. Note the different scales on the x-axis for A and B. The dashed line in B shows the predicted number of spontaneous mutations per individual. Boxplots show minimum and maximum values within 1.5 × interquartile range of the box (whiskers), median (dividing line), mean (circle), 95% confidence interval of mean (diamond), and outliers (squares). Using unpaired unequal distribution Student’s t-test: NS, not significantly different, *P < 0.05 and ***P < 0.001.

