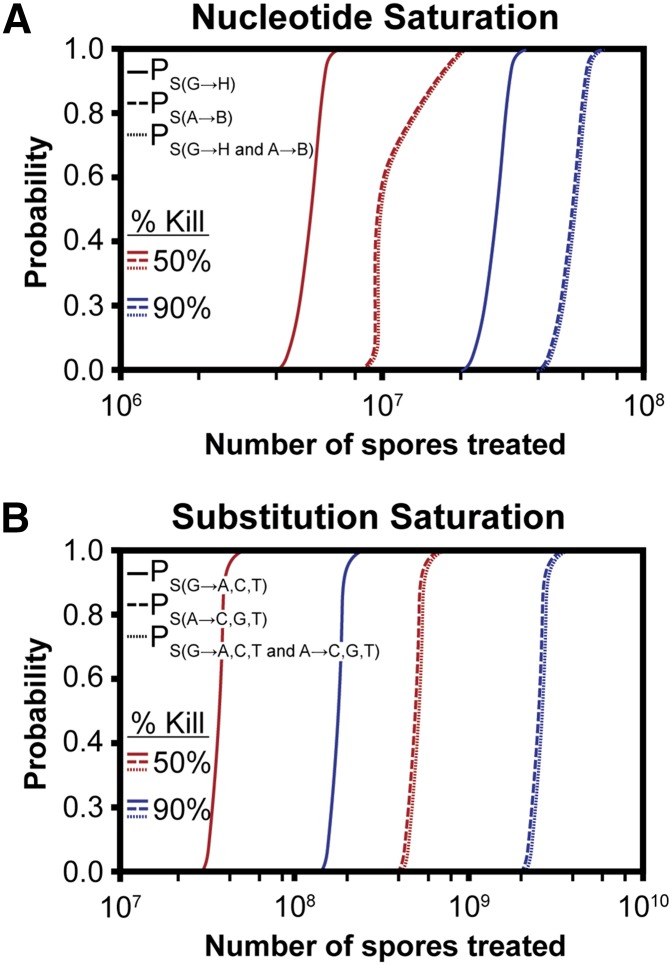
Figure 5.
Number of spores required for screen saturation. (A) Probability of mutating every G:C (solid), A:T (dashed), and every nucleotide (dotted) in the A. nidulans genome at least once (nucleotide saturation) with 4-NQO doses causing 50% (red), and 90% kill (blue) were calculated using a random sampling with replacement equation. Note, PS(G→H and A→B) = PS(A→B) as for this number of treated spores PS(G→H) = 1. (B) The same equation was used to calculate the number of spores required to generate every possible substitution at every nucleotide (substitution saturation) under the same conditions. Note, PS(G→A,C,T and A→C,G,T) = PS(A→C,G,T) as for this number of treated spores PS(G→A,C,T) = 1.

