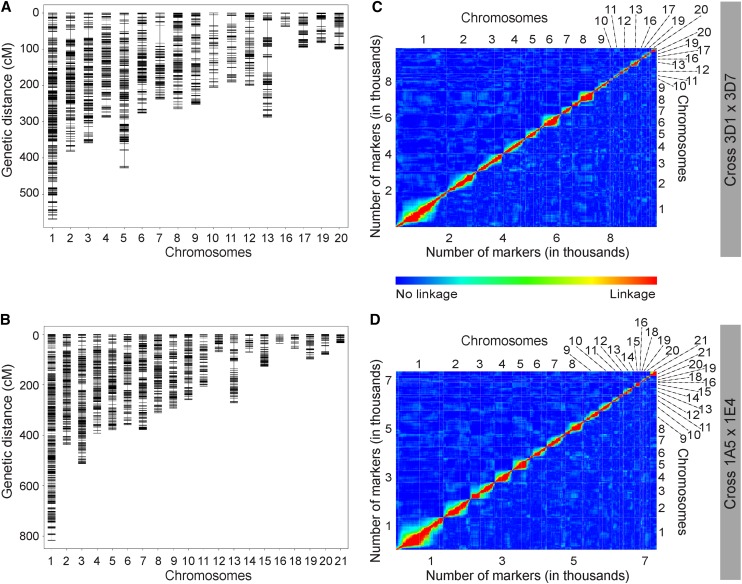
Figure 2.
(A, B) Genetic maps and (C, D) pairwise linkage comparisons of markers for each cross (Top: 3D1 × 3D7; Bottom: 1A5 × 1E4). (C, D) Within the pairwise linkage comparison plot marker-pairwise recombination fractions are shown in the upper left triangle and LOD scores for tests of r = 1/2 are shown in the lower right triangle. Red corresponds to a large LOD or a small recombination fraction, while blue is the reverse. Thus red indicates linkage, while blue indicates no linkage.

