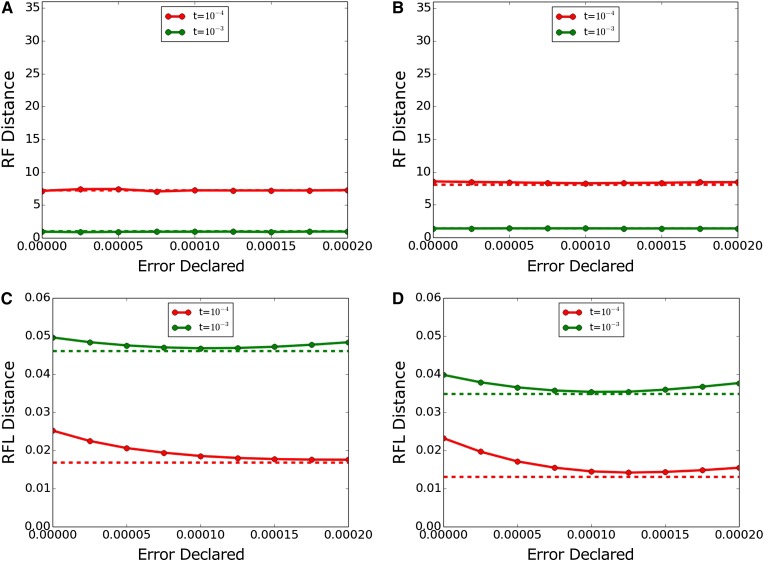
Figure 2.
Inference accuracy with true error 10−4. (A, C) Dnaml and (B, D) Dnamlk. (A, B) show RF (topology only) and (C, D) show RFL (topology and branch length). Dashed lines indicate performance with actual error 0 and declared error 0 for comparison. RF, topology-only metric of Robinson and Foulds; RFL, branch-length metric of Robinson and Foulds.

