
Figure 2. Loss of confinement and systemic dissemination of GC B cells in the absence of Gα13 or Arhgef1.
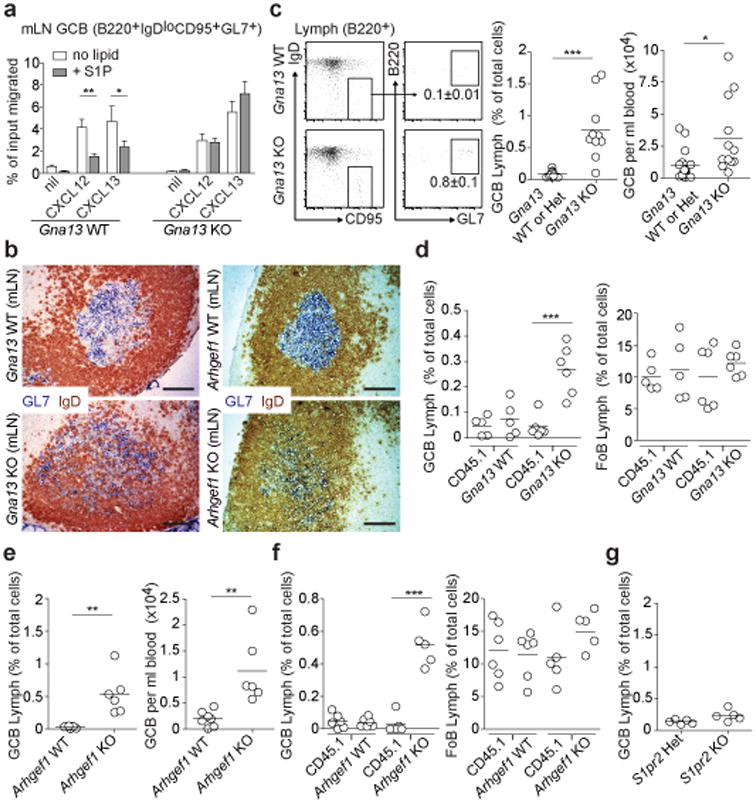
(a) Transwell migration of mLN GC B cells from Gna13 WT (f/+) or Gna13 KO (f/f mb1-cre) mice to CXCL12 (300 ng/ml) or CXCL13 (1 μg/ml) in the presence or absence of S1P (10 nM). Data are shown as mean +/-SEM and are pooled from 5 independent experiments with 2 technical replicates in each experiment. (b) Immunohistochemical analysis of mLNs from Gna13 or Arhgef1 WT or KO mice stained to detect GC B cells (GL7, blue) and naïve follicular B cells (IgD, brown). Scale bar is 100 μm. Data are representative of at least 4 mLNs of each type. (c-g) Lymph and/or blood from Gna13 WT (n=13 for lymph; n=17 for blood) or KO (n=10 for lymph; n=12 for blood) animals (c), Gna13 mixed chimeras (WT, n=5; KO, n=6) (d), Arhgef1 WT (n=7) or KO (n=6) animals (e), Arhgef1 mixed chimeras (WT, n=6; KO, n=5) (f) or S1pr2 heterozygous (n=5) or KO (n=5) animals (g) was analyzed for the presence of GC B cells by FACS. Representative FACS plot for GC B cells in lymph is shown in c with percent of total cells that are GC B cells indicated. Data are shown as GC B cell frequency amongst total cells in lymph and as cells per ml in blood. Data in c-g are pooled from between 3 and 13 independent experiments. *P<0.05, **P<0.01, ***P<0.001, unpaired two-tailed Student's t test.