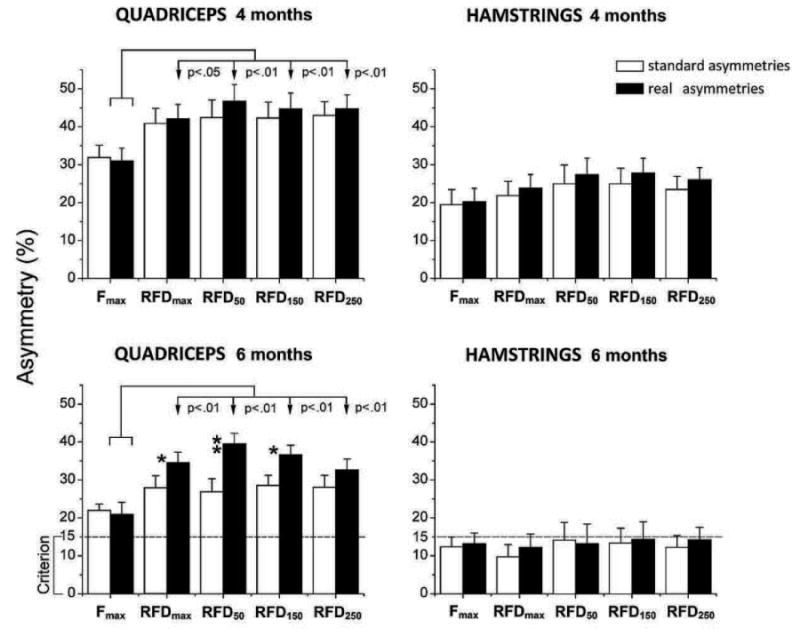
Figure 3.

Comparison of standard (white bars) and real asymmetries (black bars). Vertical arrows and p values indicate significant difference between the real asymmetries in the maximum (Fmax) and all 4 indices of explosive strength (RFDmax, RFD50, RFD150, RFD250); dashed line - generally accepted criterion for safe return to sport; * - significant difference between two types of asymmetries, p < 0.05); ** - significant difference between two types of asymmetries, p < 0.01).
