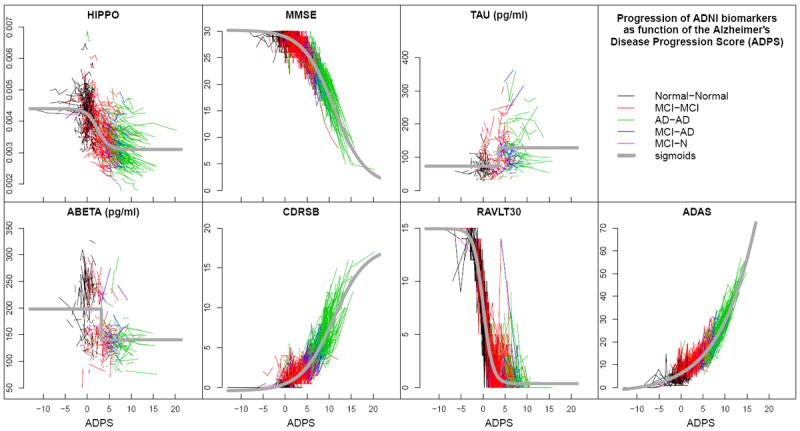
Figure 1.

The values of seven biomarkers, measured at all visits of all ADNI subjects, are plotted on the normalized ADPS. Each connected polyline represents the consecutive visits of a single subject, and each line segment is colored according to the subject’s clinical diagnoses between visits (see legend). The gray curves are the sigmoid functions representing the fitted behavior of each biomarker in the normalized space. (Reproduced from [5])
