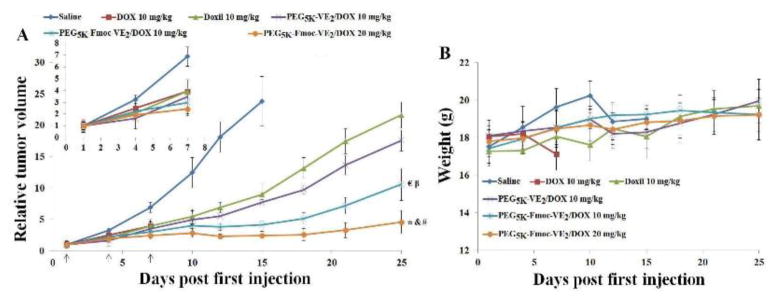
Fig. 13.

In vivo antitumor activity of different DOX formulations in 4T1.2 syngeneic mouse model. Solid arrows indicate the i.v. administration. A: relative tumor volume. B: body weight. *p < 0.0005, compared to Doxil. & p < 0.001, compared to PEG5K-VE2/DOX; # p < 0.05, compared to PEG5K-Fmoc-VE2/DOX (10 mg/kg); € p < 0.05, compared to PEG5K-VE2/DOX; β p < 0.005, compared to Doxil.
