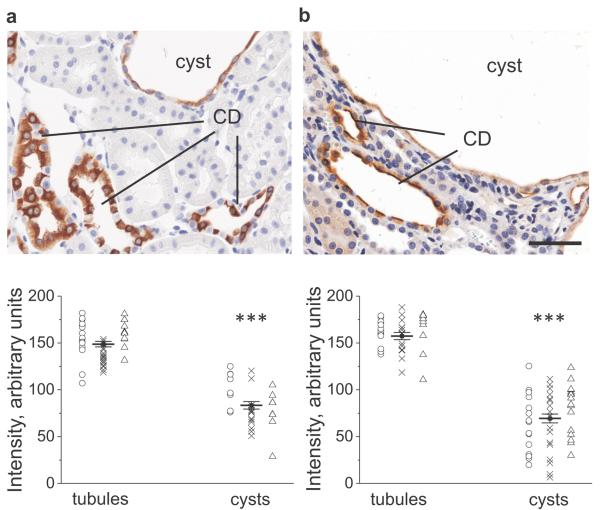
Figure 3.
ENaC and AQP2 abundance in PCK rat kidneys. Images of the representative immunohistochemical stainings for β-ENaC subunit (a) and AQP2 (b) in a 16-wks old PCK rat kidney. Magnification – 40x; scale bar is 50 μm. CD –collecting ducts. Summary graphs demonstrate individual and average signal intensities in the analyzed tubules and cysts. Circles, crosses and triangles denote three rats used for the study. **p<0.001.

