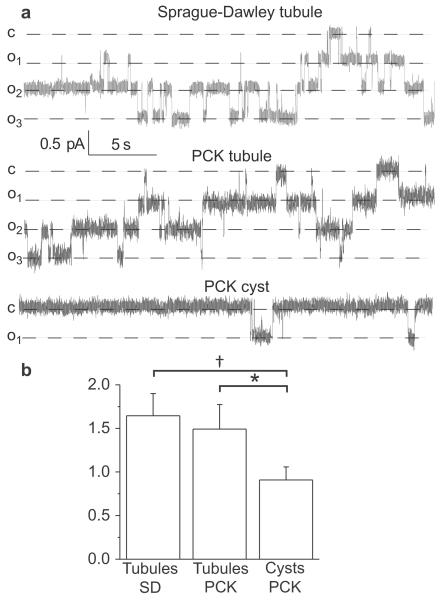
Figure 5.
ENaC activity in cystic and non-dilated tubules. (a) Representative current traces for ENaC activity measured in cell attached patches in freshly isolated non-cystic CDs and cysts of 16 week old SD or PCK rats. These patches were held at a test potential of Vh = –Vp = −40 mV. Inward Li+ currents are downward. Dashed lines indicate the respective current state with a “c” and “on” denoting the closed and open states. (b) Summary graph of observed ENaC activity (NPo). N = 6–8, recorded from 3–4 tubules or cysts isolated from different rats per group; number of patches acquired from an animal was 1–4. *P<0.05 versus PCK tubules; † P<0.05 versus SD tubules.

