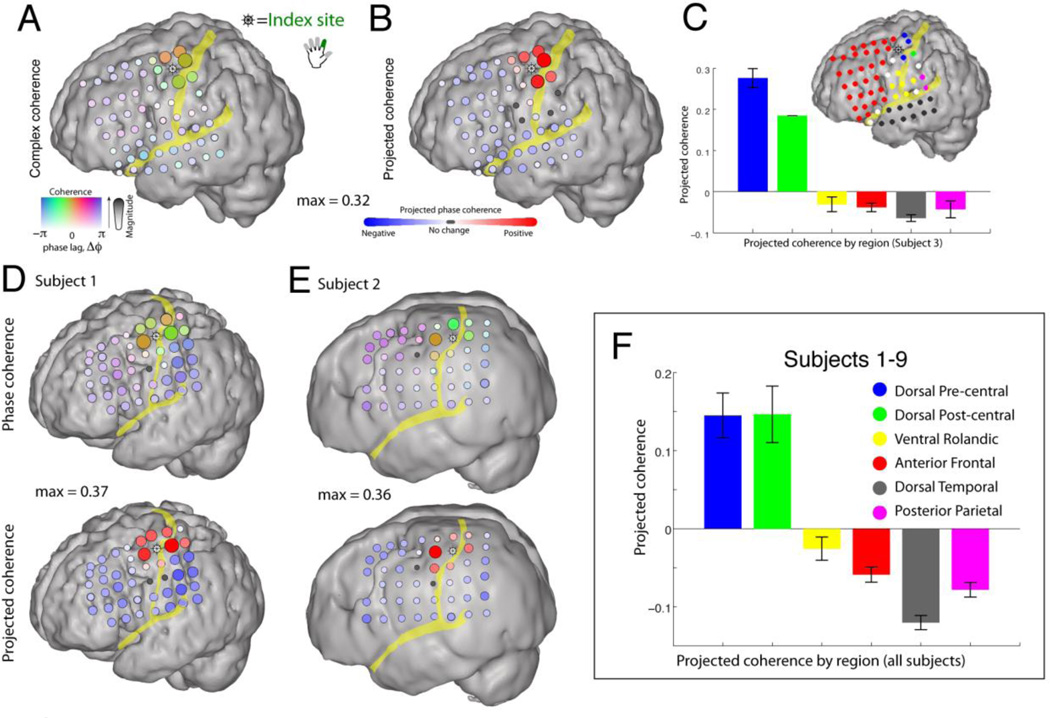
Fig. 3. Pairwise 12–20 Hz phase coherence with a pericentral motor cortex.
A seed for the coherence measure is chosen by selecting the most index finger-specific site (identified by magnitude of broadband shift), denoted with “ship wheel” symbol. (A) The pairwise phase coherence between sites is calculated with the remainder of the array (during rest periods). The magnitude of the phase coherence (max = 0.32) is reflected in the strength of the color and the electrode diameter, whereas the relative phase-lag of the phase coherence is denoted by the color. (B) To more clearly isolate spatial changes in phase, the complex phase coherence at each site was projected onto the phase of the site of maximum absolute phase coherence. (C) The mean projected phase coherence from each region (shown color coded on inset cortical rendering) is quantified, with error bars denoting the standard error of the mean within each region. (D and E) As in A and B; maximum phase coherence noted in between cortical renderings. (F) Pooled data from subjects 1–9, showing that the 12–20 Hz pairwise phase coherence is conserved within dorsal pericentral cortex, bounded by the precentral sulcus anteriorly and the postcentral sulcus posteriorly. Note that the “anti-phase coherence” is most strongly due to introduced phase coherence in the common-average process (π out of phase) in the electrodes that do not otherwise have a large β-rhythm. See Miller et al. [42] for a complete description.

