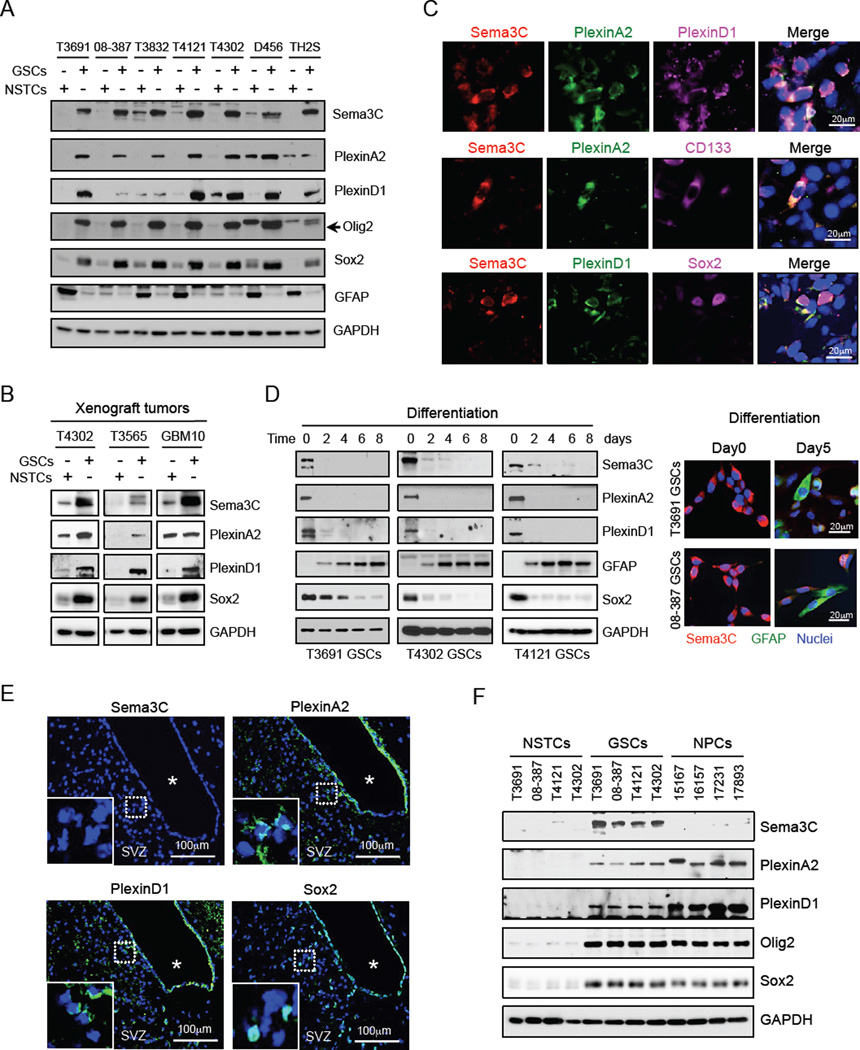
Figure 2. GSCs Preferentially Co-express Sema3C and Its Receptors.
(A) Immunoblot (IB) analysis of Sema3C, PlexinA2 and PlexinD1 in GSCs and matched NSTCs derived from human GBM.
(B) IB analysis of Sema3C, PlexinA2 and PlexinD1 proteins in GSCs compared to NSTCs isolated via CD133-based sorting from T4302, T3565 and GBM10 xenograft tumors without intervening in vitro culture.
(C) IF staining of Sema3C, PlexinA2, PlexinD1 and GSC markers CD133 and Sox2 on frozen sections of T4302 GSC-derived GBM xenografts. Nuclei were counterstained with DAPI (blue).
(D) GSC differentiation was induced by serum (5% FBS). IB analysis of Sema3C, PlexinA2, PlexinD1, Sox2 and GFAP (astrocyte marker) proteins during GSC differentiation (left). IF staining of Sema3C (red) and GFAP (green) from day 0 to day 5 during GSC differentiation (right). Nuclei were counterstained with DAPI (blue).
(E) IF staining of Sema3C, PlexinA2, PlexinD1 or Sox2 in the subventricular zone (SVZ) in adult mouse brain. Sections were counterstained with DAPI. * denotes ventricle.
(F) IB analysis of Sema3C, PlexinA2 and PlexinD1 proteins in four GSCs, matched NSTCs and four human NPC lines.
See also Figure S2.

