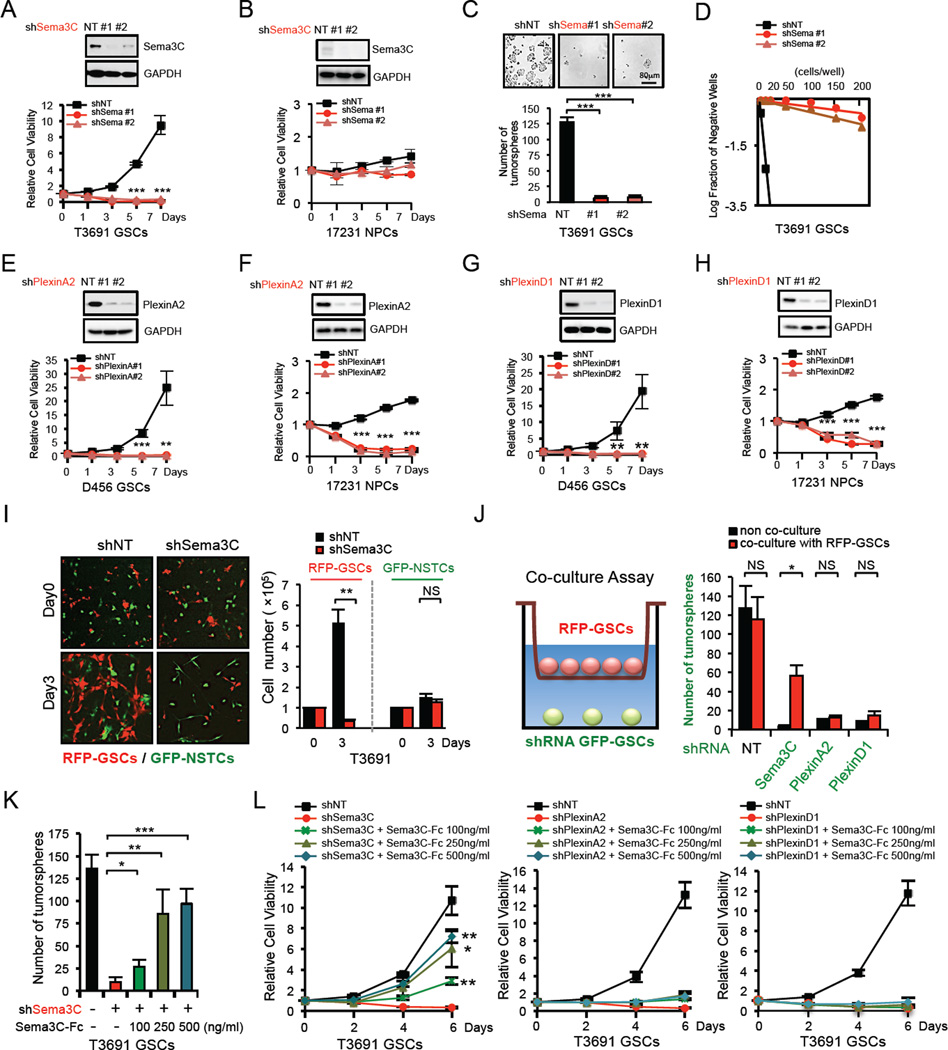
Figure 3. GSC Viability and Self-Renewal Depend on Sema3C Secretion.
(A–D) Effects of Sema3C knockdown with two different shRNA sequences on cell viability in GSCs and NPCs, and tumorsphere formation of GSCs. Knockdown of Sema3C resulted in a decrease in cell viability in GSCs (A), but not in NPCs (B). shSema3C–GSCs showed reduced tumorsphere numbers (C). For the limiting dilution assay, GSCs expressing shNT or shSema3C were plated into 96-well plates with various seeding densities (1–200 cells per well, 12 wells per each condition). Seven days later, each well was evaluated for the presence or absence of tumorspheres (D).
(E–H) Effects of PlexinA2 or PlexinD1 knockdown with two different shRNA sequences on cell viability of GSCs (E, G) and NPCs (F, H).
(I) GSCs and matched NSTCs stably expressing RFP or GFP were mixed and plated on stem cell Matrigel-coated plates at 1:1 ratio and infected by lentivirus containing shNT or shSema3C. RFP-GSC or GFP-NSTC were counted at indicated times after infection (right). Representative images of mixed cells on day 0 and day 3 are shown (left).
(J) GFP-GSCs transduced with shNT, shSema3C, shPlexinA2 or shPlexinD1 were plated at low cell density (500 cells) at the base of transwells and co-cultured with RFP-GSCs (1×10⁵ cells) that were seeded in the upper chambers of transwells. GFP-GSC tumorsphere number was counted on day 6 of co-culture (right). Representative diagram of the co-culture assay is shown (left).
(K and L) GSCs transduced with shNT, shSema3C, shPlexinA2 or shPlexinD1 were cultured with different doses of recombinant human Sema3C protein (Sema3C–Fc). GSC tumorsphere quantification is shown (K) and GSC viability was assessed by cell titer assay (L).
Data are means ± standard deviation (SD) (n = 3). *p< 0.05, **p < 0.01, ***p < 0.001. See also Figure S3.

