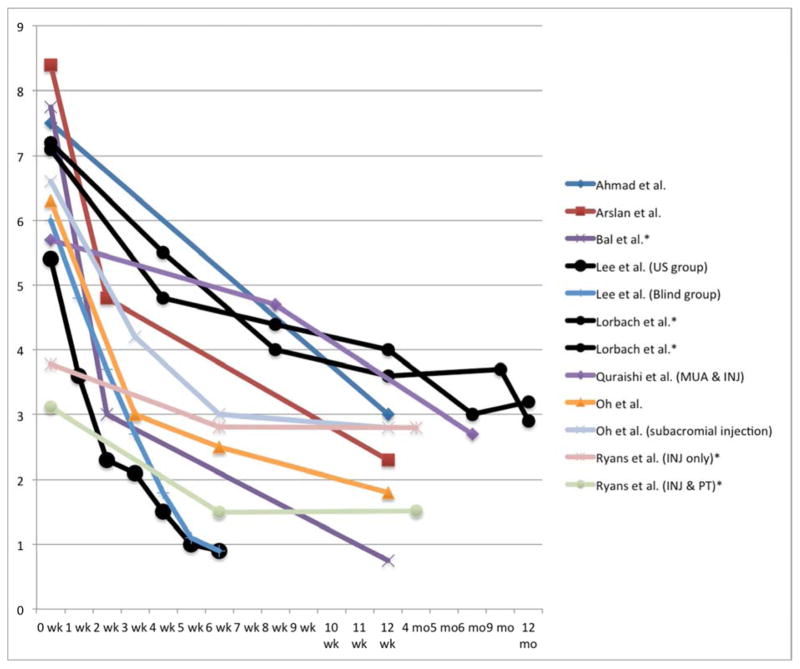
Figure 2.
VAS improvements over time in corticosteroid injection groups. Image-guided injections are indicated with black lines and circle data points. (US = ultrasound, INJ = injection, PT = physical therapy)
*Visual analog scale adjusted to a 0 to 10 scale where 0 represents “no pain” and 10 represents the “worst possible pain”

