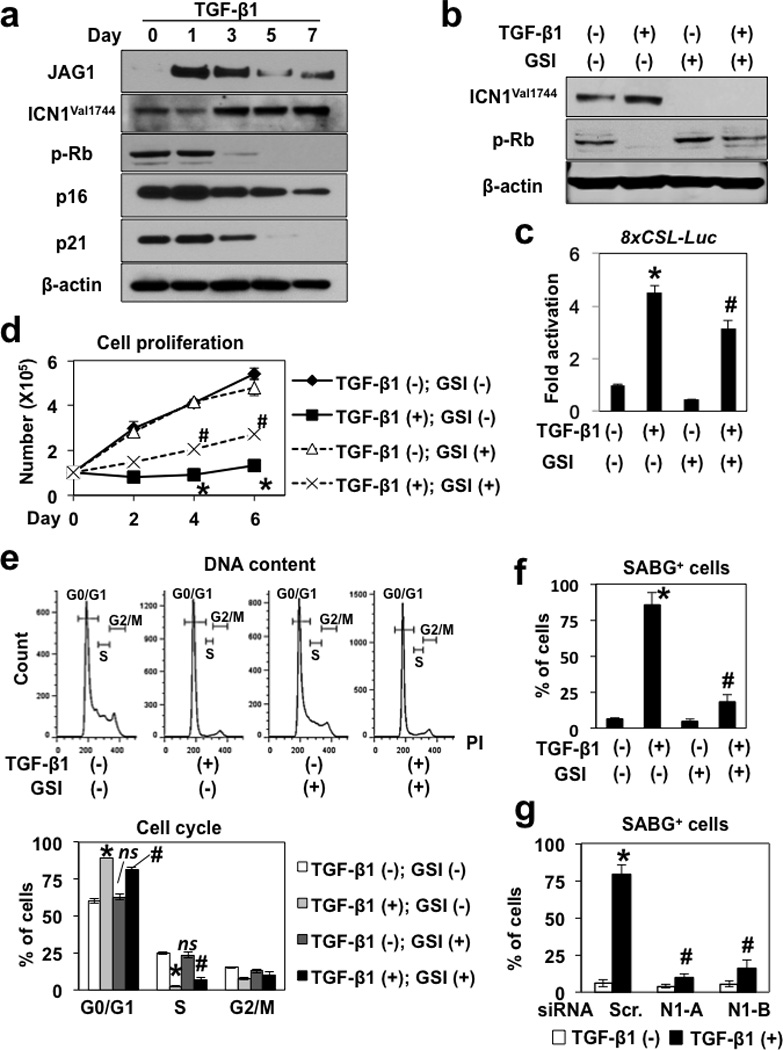
Figure 6. TGF-β stimulates endogenous Notch1 to mediate senescence in EPC2-hTERT cells.

EPC2-hTERT cells were stimulated with 5 ng/ml TGF-β1 alone, or along with either GSI (1µM compound E) or DMSO (vehicle) in (a)–(f). Cells were transiently transfected with a 8xCSL-luc Notch reporter construct 24 h prior to TGF-β stimulation in (c) and siRNA directed against Notch1 (N1-A and N1-B) 24 h prior to TGF-β stimulation in (g). Cells were analyzed at indicated time points in (a) and (d); and 7 d after TGF-β stimulation in (b), (c), (e)–(g). Western blotting determined indicated molecules with β-actin serving as a loading control in (a) and (b). In (c), luciferase assays determined activation of the 8xCSL-luc Notch reporter construct. In (d), cell number was counted to determine cell proliferation. In (e), flow cytometry was done to determine cell-cycle. In (f) and (g), SABG assays were carried out and scored (see Supplementary Figure S12a and c for representative photomicrographs). In (c), *, P <0.05 vs. TGF-β1 (−) and GSI (−); #, P <0.05 vs. TGF-β1 (+) and GSI (−); (n=3). In (d), *, P <0.05 vs. TGF-β1 (−) and GSI (−); #, P <0.05 vs. TGF-β1 (+) and GSI (−); (n=3). In (e), representative histogram plots are shown. Histograms show proportions of cells in G0/G1, S and G2/M cell-cycle phases. *, P < 0.05 vs. TGF-β (−) and GSI (−); nsnot significant vs. TGF-β (−) and GSI (−); #, P < 0.05 vs. TGF-β (+) and GSI (−); (n=3). In (f), *, P <0.05 vs. TGF-β1 (−) and GSI (−); #, P <0.05 vs. TGF-β1 (+) and GSI (−); (n=6). In (g), *, P <0.05 vs. TGF-β1 (−) and Scr. (−); #, P <0.05 vs. TGF-β1 (+) and Scr.; (n=6).
