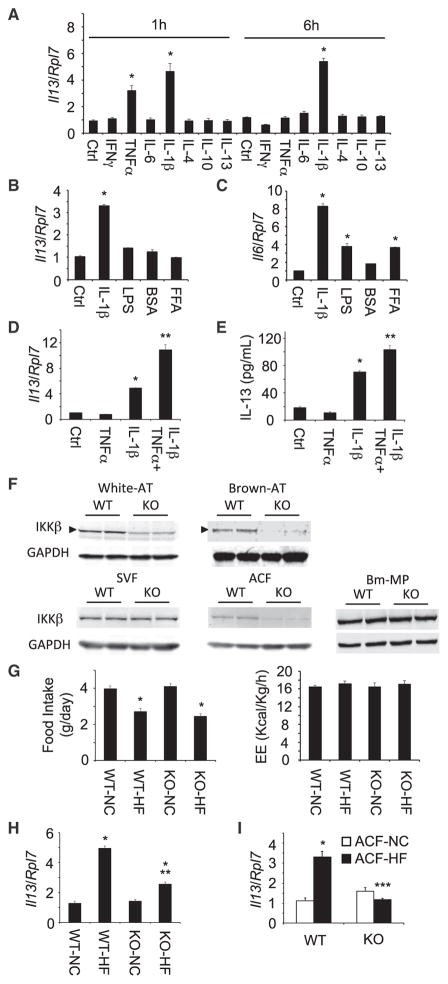
Figure 2. IL-1β and TNF-α Induced the Expression of IL-13 in Adipocytes, and HFD-Induced IL-13 Expression in Adipocytes Was Diminished in Adipocyte-Specific IKKβ Knockout Mice.
(A) TNF-α and IL-1β-induced IL-13 expression in 3T3-L1 adipocytes. Cytokines (20 ng/ml except IL-1β [10 ng/ml]) were treated for 1 or 6 hr (n = 4–6 per group).
(B and C) FFA and endotoxin did not induce IL-13 expression in 3T3-L1 adipocytes (n = 4). FFA (1 mM palmitate and BSA adduct) and endotoxin LPS (50 ng/ml) were treated for 6 hr.
(D and E) TNF-α and IL-1β-induced synergistic expression of IL-13 in 3T3-L1 adipocytes (n = 4–8 per group). Cytokines were treated for 6 hr. All data are the mean ± SEM, *p < 0.0007 compared with control (Ctrl), **p < 0.0003 compared with IL-1β.
(F) IKKβ expression in WT and Ad-IKKβKO (KO) mice. NCD-fed mice (5–7 weeks old) were used.
(G) Food intake and energy expenditure (EE) of WT and Ad-IKKβKO (KO) mice after NCD or HFD feeding for 12–14 weeks (n = 4–6 per group).
(H) IL-13 expression in epididymal adipose tissues of HFD-fed WT (WT-HF) and Ad-IKKβKO (KO-HF) mice (n = 5–7 per group).
(I) IL-13 expression in ACF prepared from HFD-fed WT and Ad-IKKβKO (n = 5–7 per group).
All data are the mean ± SEM, *p < 0.004 compared with NC, **p < 0.0034 compared with WT-HF, ***p < 0.0001 compared with WT ACF-HF.

