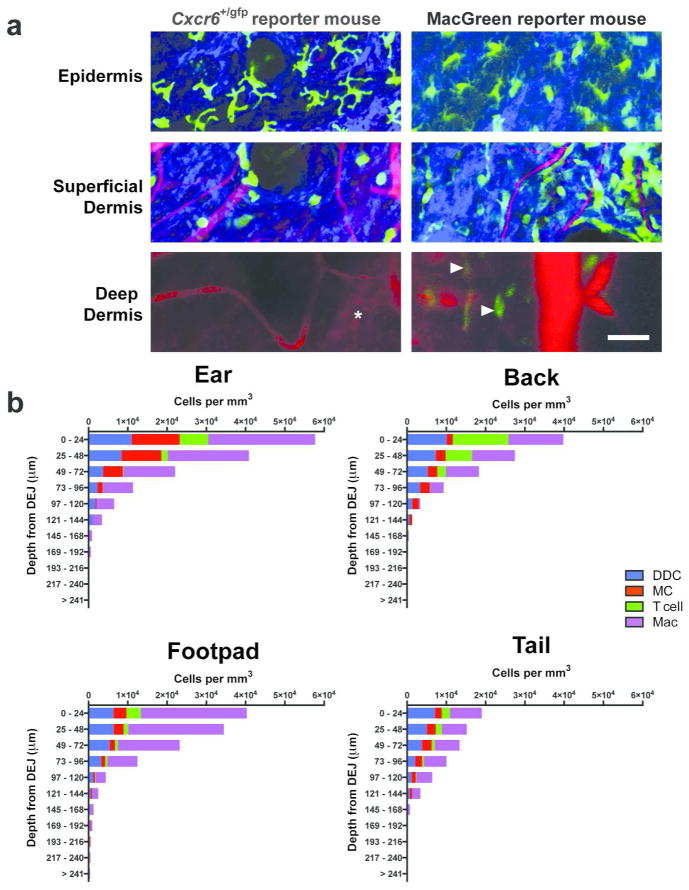
Figure 1. Deep tissue imaging by multiphoton microscopy demonstrates that spatial distribution of dermal leukocytes differ not only in depth but also between sites.
(a) Intravital imaging of ear skin of Cxcr6+/gfp and Csf1r-EGFP (MacGreen) mice at various depths showing GFP+ cells (green) in the deep dermis (arrowheads), extracellular matrix in the dermis (SHG signals, blue) and blood vessels (Evans blue, red). Cartilage is visualized through autofluorescence (asterisk) (representative images from n = 2 mice per strain). Scale bar 50 μm. (b) Calculated densities of dermal dendritic cells (DDC), mast cells (MC), T cells and macrophages (Mac) at different sites, stratified by distance from the dermo-epidermal junction (DEJ). n = 3 for all strains; 6–12 fields of view per site, with flow cytometric adjustment for fluorescence expression with at least 12 mice per strain.

