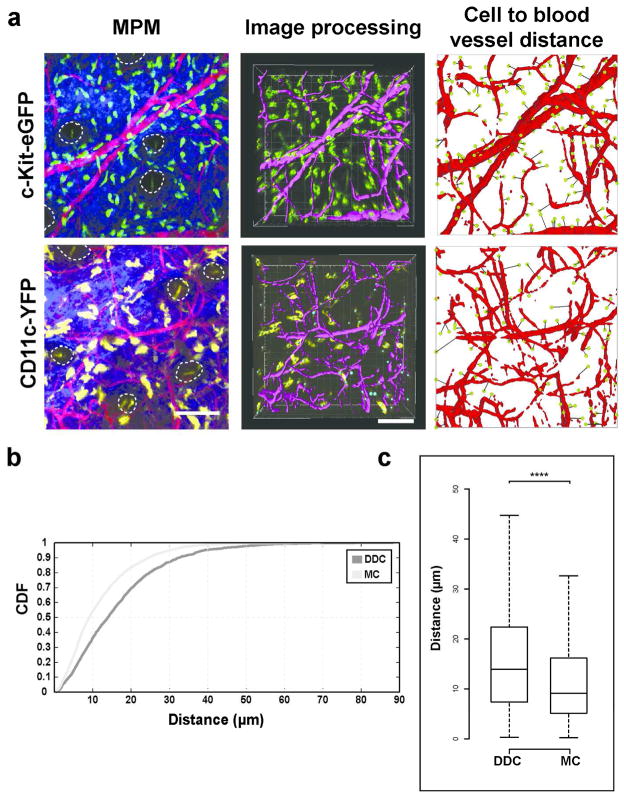
Figure 4. Customized automated cell to blood vessel distance analysis of a migratory and non-migratory dermal population.
(a) Left: Representative intravital multiphoton microscopy (MPM) images of c-Kit-eGFP and CD11c-YFP ear skin showing GFP+ mast cells (MC; top, green), YFP+ dermal dendritic cells (DDC; bottom, yellow), extracellular matrix (SHG signals, blue) and vasculature (Evans blue, red). Middle: Computer-assisted recognition of cells (spots, yellow or green) and vasculature (purple). Right: Calculations of distances from every cell to nearest blood vessels (path in black). (b) Cumulative distribution function (CDF) of nearest distances of MC and DDC to vasculature in c-Kit-eGFP and CD11c-YFP mice respectively (in μm). (c) Box-whisker plot of cell to blood vessel distance in indicated populations (outliers excluded). n = 3 mice; 27 fields of view per strain; > 2000 cells examined; ****P < 0.0001 (Mann-Whitney U test). Scale bar 100 μm.

