
Figure 4. Electrogoniometer.
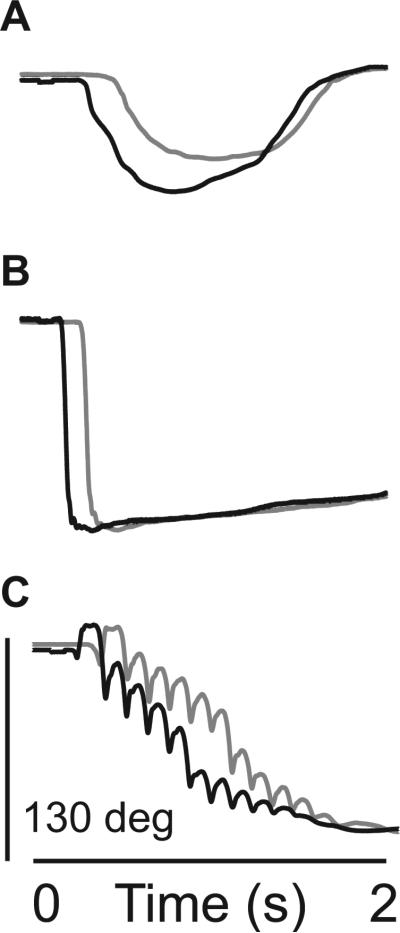
Representative goniometer data from HI SCM+ (black) and HI SCM- (gray) trials from stroke subjects with moderate (A: Chedoke = 4), mild/moderate (B: Chedoke = 6), and mild (C: Chedoke = 7) impairment.
Official websites use .gov
A
.gov website belongs to an official
government organization in the United States.
Secure .gov websites use HTTPS
A lock (
) or https:// means you've safely
connected to the .gov website. Share sensitive
information only on official, secure websites.
Representative goniometer data from HI SCM+ (black) and HI SCM- (gray) trials from stroke subjects with moderate (A: Chedoke = 4), mild/moderate (B: Chedoke = 6), and mild (C: Chedoke = 7) impairment.