Figure 4. Electrogoniometer.

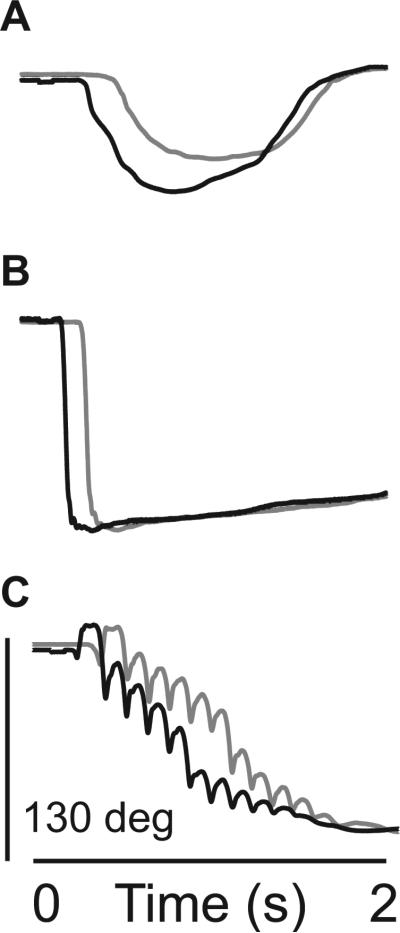
Representative goniometer data from HI SCM+ (black) and HI SCM- (gray) trials from stroke subjects with moderate (A: Chedoke = 4), mild/moderate (B: Chedoke = 6), and mild (C: Chedoke = 7) impairment.

Representative goniometer data from HI SCM+ (black) and HI SCM- (gray) trials from stroke subjects with moderate (A: Chedoke = 4), mild/moderate (B: Chedoke = 6), and mild (C: Chedoke = 7) impairment.