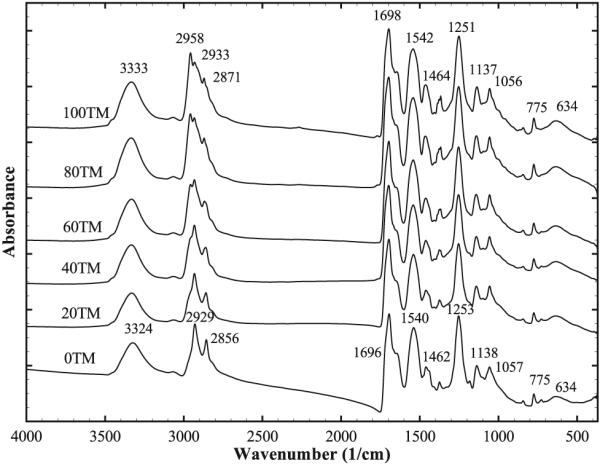
Figure 5.

FTIR curves of the different foam compositions. Changes in the C–H vibrations of the −CH3 groups of TMHDI are evident in the 2800–3000,1430–1490, and 1350–1400 cm−1 ranges.

FTIR curves of the different foam compositions. Changes in the C–H vibrations of the −CH3 groups of TMHDI are evident in the 2800–3000,1430–1490, and 1350–1400 cm−1 ranges.