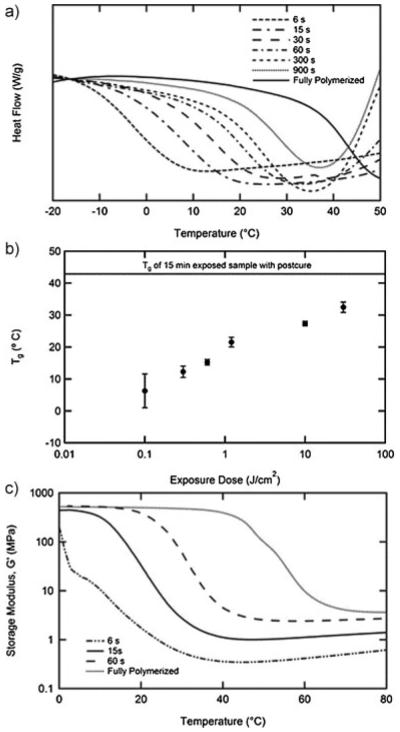
Figure 3.
Differential scanning calorimetry of thiol–ene/acrylate composition stopped at different reaction times during the reaction (a). The midpoint of the glass transition from DSC at various stages in the reaction (n = 4, error bars represent standard deviation) (b). DMA of select partially polymerized films (c).

