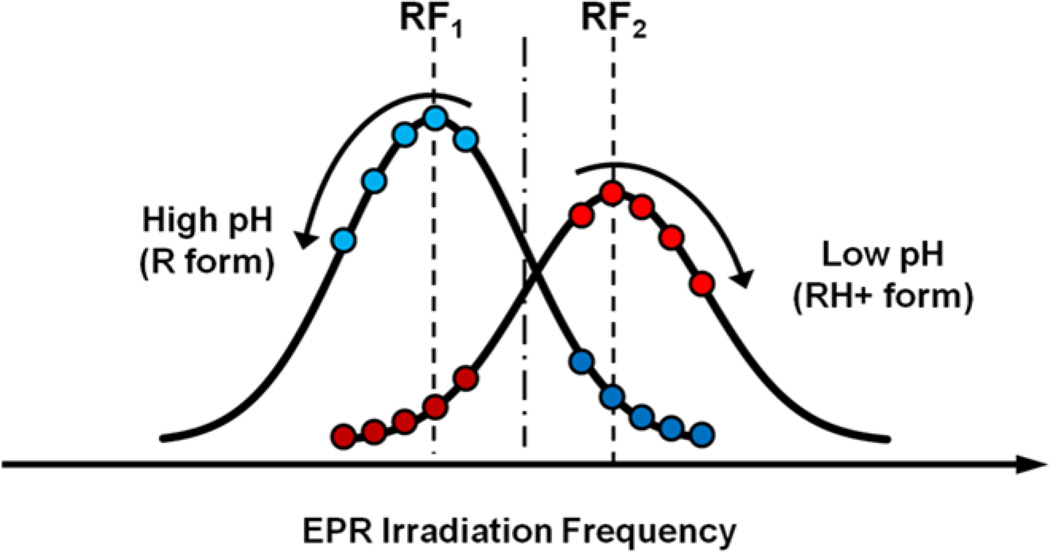
Figure 4.
The illustration of optimization of EPR frequencies for PEDRI pH mapping. The EPR resonator was tuned to 573.800 MHz. The EPR frequencies RF1 and RF2 were varied with 25 kHz increment step. Offset from the EPR resonator central frequency did not exceed 200 kHz and did not lead to significant increase in microwave power reflection and reduction of irradiation efficiency. The acquired PEDRI images were analyzed for the changes in normalized intensity ratio, I (RF1)/(I(RF1)+ I(RF2)), over total pH range from pH 5.51 to pH 8.85 (see Fig.1). The RF1 and RF2 frequencies that provide the biggest difference, namely RF1 = 573.625 MHz and RF2 = 573.950 MHz, were selected for further pH mapping.

