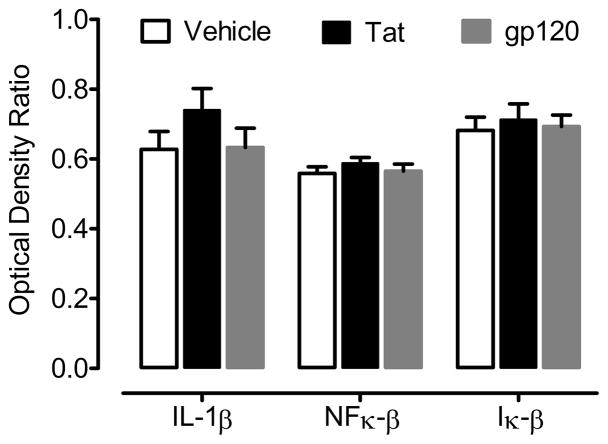
Figure 5.
Mean (± SEM) optical density ratio values of biomarkers reflecting the potential activation of inflammatory pathways as a function of in vivo neonatal Tat or gp120 treatment. Statistical analysis failed to detect any significant increase in the expression of IL-1β, NFκ-β, or Iκ-β in Tat1-86 -treated (non-significant % increases of 17.9 %, 4.5 %, and 5.3 %, respectively) or gp120-treated (all values within 2 % of control) animals.

