Figure 1.
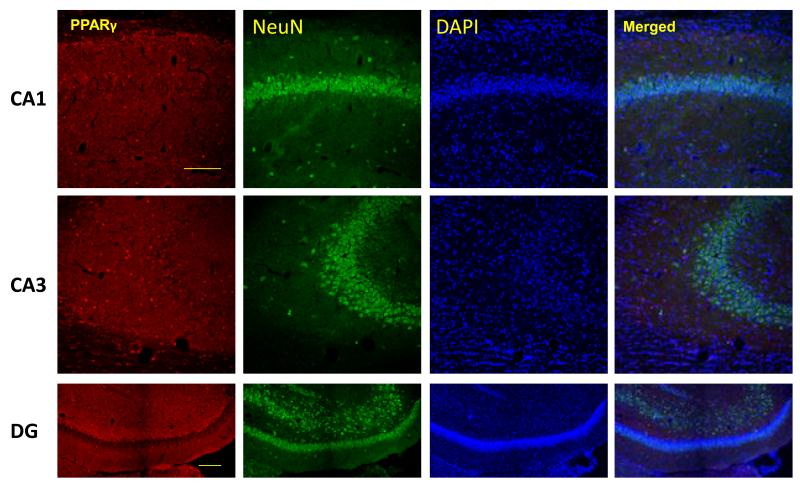
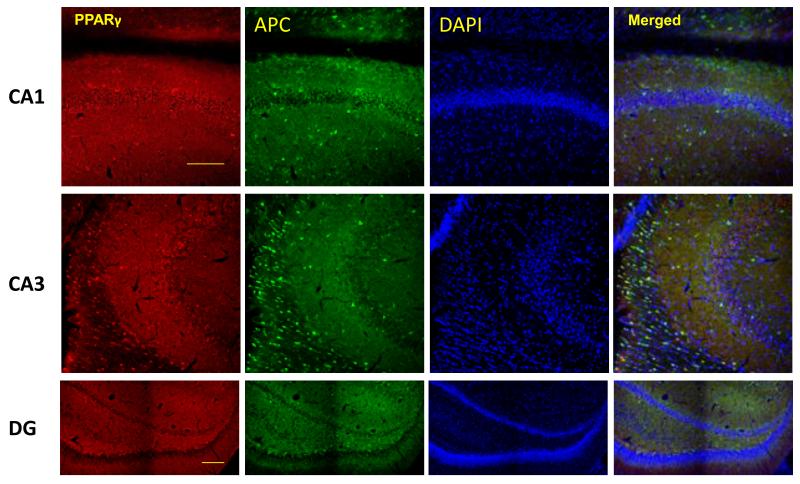
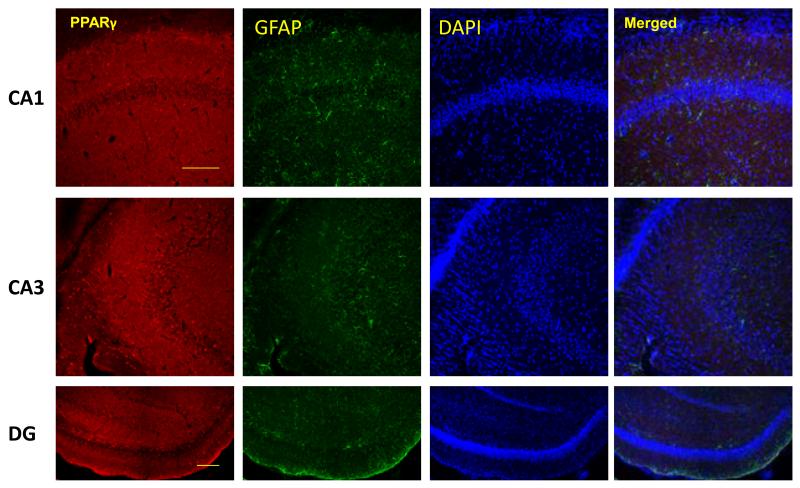
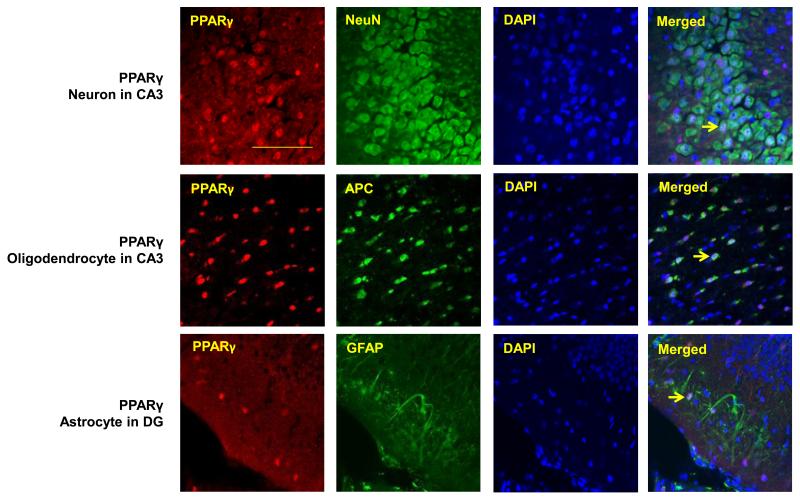
PPARγ is expressed in neurons, oligodendocytes and astrocytes of the rat hippocampus. Representative images of PPARγ (red) co-immunoflorescent staining with A) NeuN for neurons(green), B) APC for oligodendrocytes (green), and GFAP for astrocytes(green) in CA1, CA3 and dentate gyrus (DG) subregions of the rat hippocampus. Nuclei were counterstained with DAPI (blue). Three colors equally merged shows in white. D) Arrows show representative PPARγ positive cells in each case. Scale bar=100μm.


