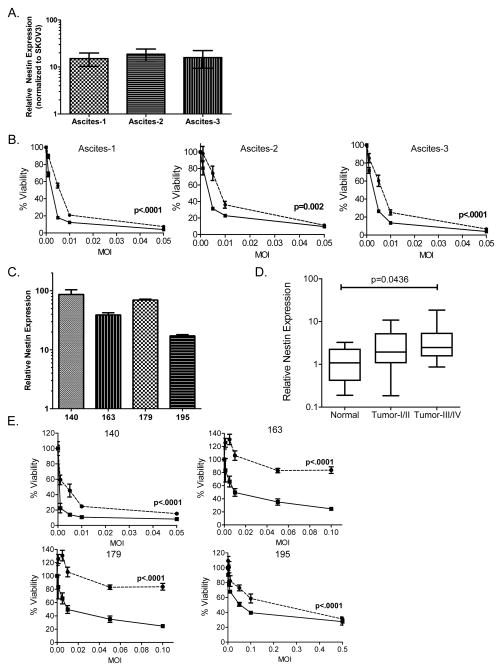
Figure 2.
Increased sensitivity of nestin-positive experimental murine ascites- and patient ascites-derived tumor cells to oncolytic virus (OV) ex vivo. (A) Ascites-derived SKOV3 cells isolated from the experimental model of ovarian cancer have elevated nestin expression compared to SKOV3 cells grown in vitro. Data shown are nestin expression from three mouse isolates (ascites-1, ascites-2 and ascites-3) normalized to SKOV3 grown in vitro; error bars indicate standard deviation. (B) Murine ascites-derived SKOV3 tumor cells were tested for sensitivity to 34.5ENVE- (solid line, ■) and revertant ENVE-mediated (dotted line, ●) cytotoxicity. Cells were infected at increasing MOI, and viability was assessed 3 days after treatment using MTT assay. Data shown are % viable cells relative to untreated cells; error bars indicate standard deviation. Linear models were used to compare the means of two groups. P values shown represent the overall test result by linear models for the comparison between 34.5ENVE and revertant ENVE across all MOI levels.(C) Nestin expression is elevated in patient ascites-derived tumor cells. Data shown are nestin expression levels from four patient-derived ovarian cancer isolates (de-identified patient numbers 140, 163, 179, 195), normalized to normal ovarian tissue samples (from patients with endometriosis, carcinoma of the bladder, or leiomyoma of the myometrium; n=6); error bars indicate standard deviation. (D) Nestin expression increases as ovarian cancer tumor grade increases, as indicated in 48 human samples. Tissue Scan Disease Panel contained 48 samples from pathologist-verified ovarian cancer tissue cDNA including 6 normal, 14 Stage I, 5 Stage II, 22 Stage III and 1 Stage IV samples. Samples were tested for nestin expression, and normalized to beta actin. Data shown is a box-and-whisker plot; ANOVA models were used to compare the mean of multiple groups (p value adjusted by Holm’s procedure). (E) Patient ascites-derived ovarian cancer cells were tested for sensitivity to 34.5ENVE- (solid line, ■) and revertant ENVE-mediated (dotted line, ●) cytotoxicity. Cells were infected at increasing MOI, and viability was assessed 3 days after treatment using MTT assay. Data shown are % viable cells relative to untreated controls; error bars indicate standard deviation. Linear models were used to compare the means of two groups. P values shown represent the overall test result by linear models for the comparison between 34.5ENVE and revertant ENVE across all MOI levels.

