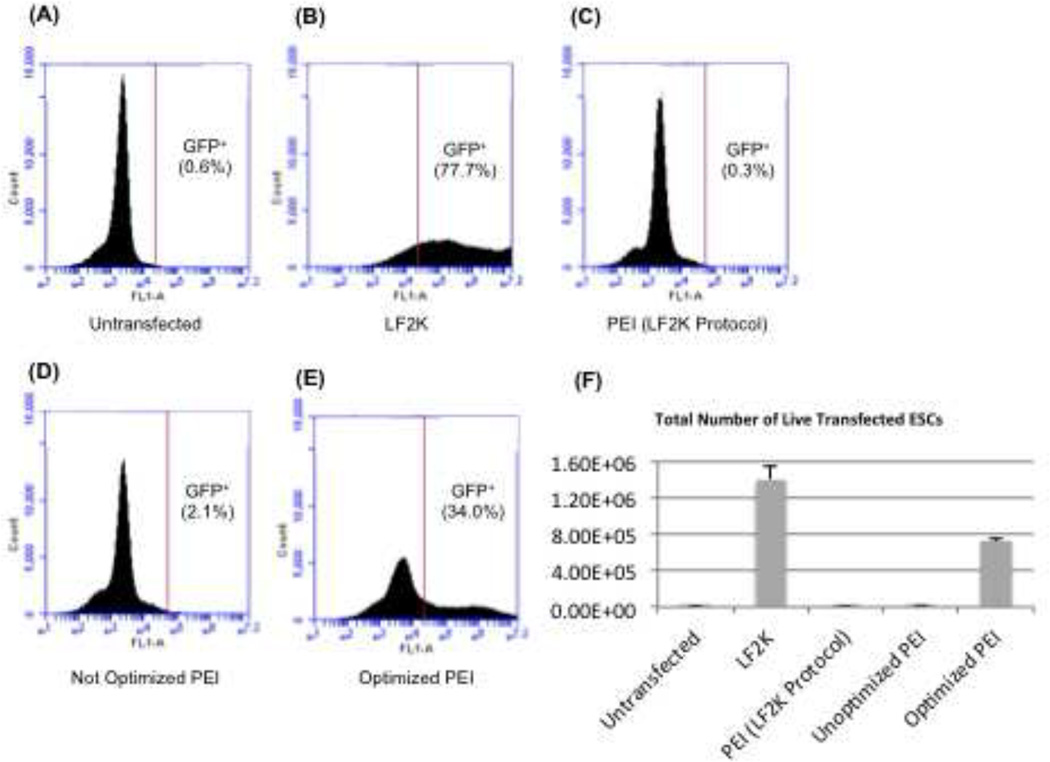
Figure 2.
Quantification of transfected cells. This data represents flow cytometry analysis of WT mouse ESCs transfected with 2 µg pMaxGFP. All analyses were performed on 3 independent ESC transfections. For images A – E, the x-axis represents fluorescence and the y-axis represents the number of cells detected at a certain fluorescence by the flow cytometer. (A) Untransfected mouse ESCs were used as a reference and the gating was set such that 0.6% of cells were untransfected. (B) LF2K transfection efficiency averaged 77.7% (n=3). (C) PEI substituted in the LF2K protocol resulted in 0.3% transfected cells (n=3). (D) Increasing the PEI concentration achieved an average of 2.1% transfected ESCs (n=3). (E) The optimized PEI protocol achieved 34% transfected ESCs (n=3). (F) This graph shows the percentage of GFP+ cells determined in (A-E). The x-axis represents the conditions compared in this manuscript, and the y-axis represents percent transfection as determined by flow cytometry. Error bars represent the standard error of the mean (SEM).

