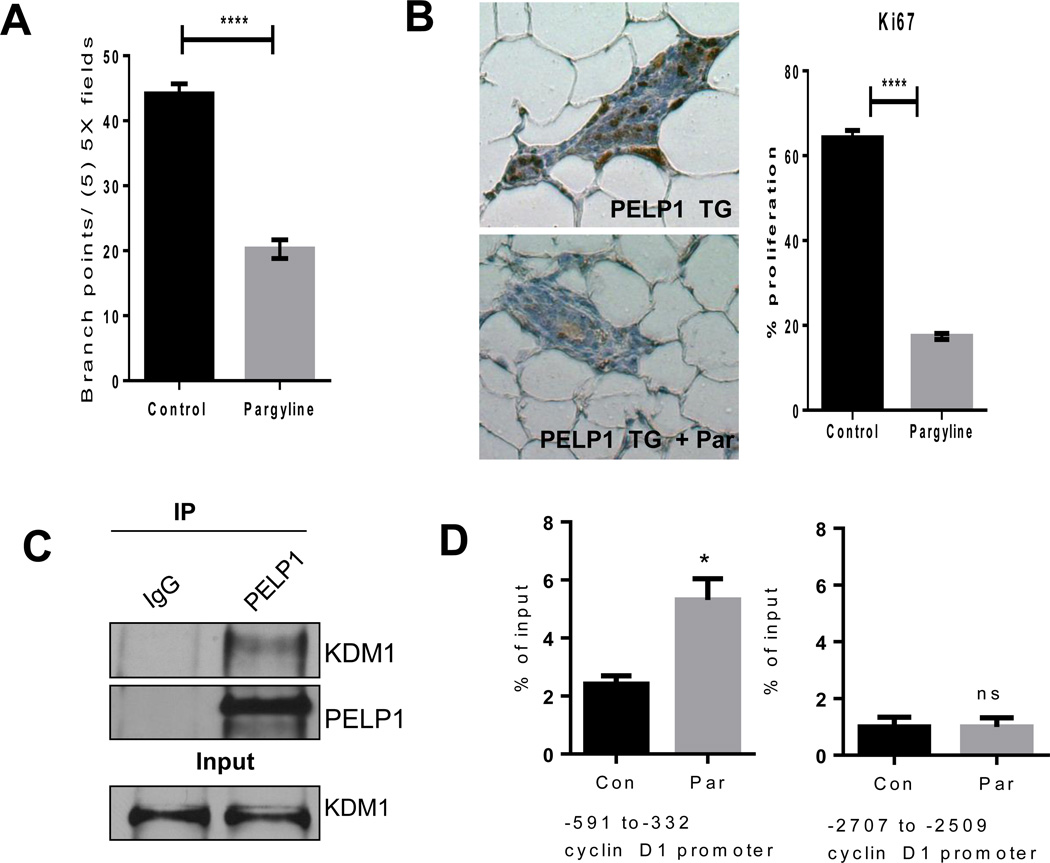
Figure 6.
Effect of pargyline treatment on PELP1-induced hyperplasia. A, Side branching quantification (means +/− sem) in the mammary glands of 6-month-old MMTV-rtTA-TetO-PELP1 bitransgenic mice treated with PBS or pargyline. All experimental data points were generated from three biological replicates per transgenic line. Statistical significance was determined by using a Student’s t test.****p<0.0001. B, Mammary epithelial proliferation as reflected by IHC analysis of Ki-67 expression in the mammary glands of 6-month-old MMTV-rtTA-TetO-PELP1 bitransgenic mice treated with PBS or pargyline. Proliferation index was calculated relative to a percentage of total epithelial cell nuclei counts in five 20X fields per slide. All experimental data points were generated from three biological replicates per transgenic line. Statistical significance was determined by using a Student’s t test.****p<0.0001. C, Total lysates from the mammary glands of 6-month-old MMTV-rtTA-TetO-PELP1 bitransgenic mice were subjected to immunoprecipitation using the PELP1 antibody and PELP1–KDM1 interaction was verified by western analysis. D, ChIP assay was done using the DNA isolated from the mammary glands of 6-month-old MMTV-rtTA-TetO-PELP1 bitransgenic mice (n=3) treated with PBS or pargyline with antibodies specific for dimethyl H3K9. DNA recovered from ChIP or input controls was subjected to real-time quantitative PCR with primers specific to −591 to −332 and −2707 to −2509 that represent the proximal and distal promoter regions of mouse cyclin D1 promoter. Statistical significance was determined by using a Student’s t test. *p<0.05.

