
Figure 3. KRAS Negatively Regulates TET1 Expression through the ERK Signaling Pathway.
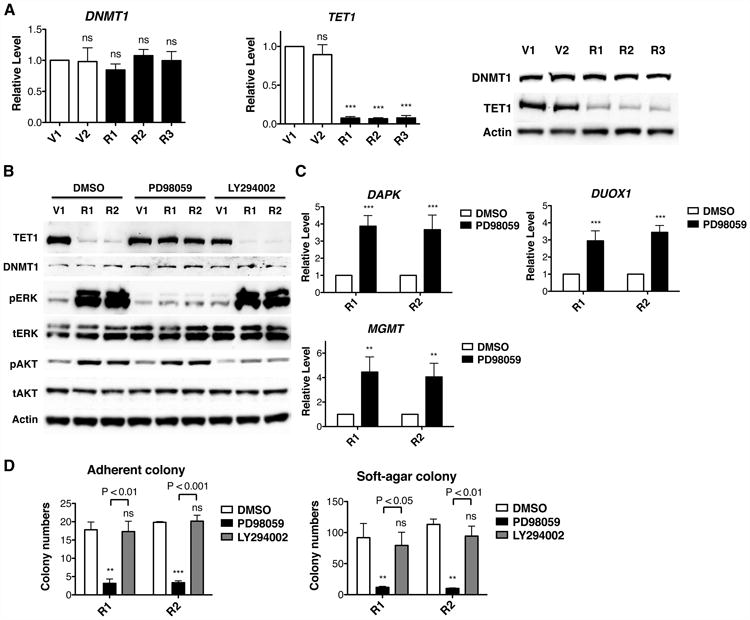
(A) In HBEC3 cell lines, mRNA levels of DNMT1 and TET1 were determined by RT-qPCR and normalized to V1 cells. Protein levels were determined by western blotting.
(B) After 30 μM ERK pathway inhibitor PD98059 or 2 μM AKT pathway inhibitor LY294002 treatment for 6 days, protein levels of DNMT1 and TET1 were determined by western blotting.
(C) After ERK pathway inhibition, mRNA levels were analyzed by RT-qPCR and normalized to DMSO control.
(D) Adherent and soft-agar colony formation after ERK pathway or AKT pathway inhibition indicate that cellular transformation is mediated by the ERK pathway. Cells were pre-treated with inhibitors for 6 days and then tested for colony formation. All data are presented as mean ± SD. ns, no significant difference; **, p < 0.01; ***, p < 0.001 in comparison to V1 cells or DMSO treated control. See also Figure S2.