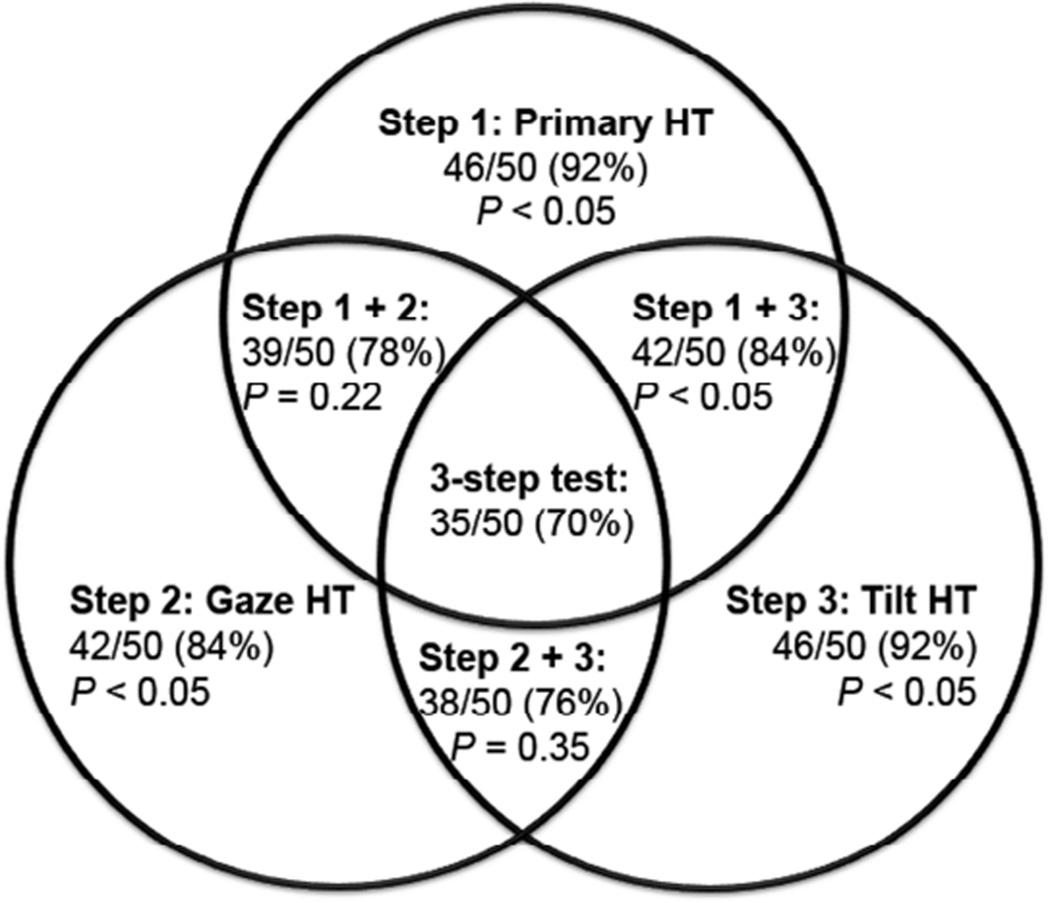
FIG. 3.
Venn diagram illustrating sensitivities of combinations of individual test steps in diagnosis of superior oblique palsy. Any one step individually is more sensitive than the three-step test (P < 0.05). The combination of steps 1 and 3 is more sensitive than the three-step test (P < 0.05), but no other combination of steps had sensitivity exceeding the complete three-step test. HT, hypertropia.

